Metrics
Metrics in SignalSync allow you to define, collect, and track key performance indicators (KPIs) across your workflows and entities. You can aggregate data by time intervals, set target thresholds, and monitor performance through automated data collection.
The Metrics feature is currently in active development. This documentation covers the basic functionality available now. Additional features and enhancements will be released throughout 2026, including advanced analytics, custom formulas, and real-time alerting capabilities.
Overview
Metrics provide quantitative measurements of workflow activity and entity data over time. Common use cases include:
- Request Volume Tracking: Count requests by type, location, priority, or status
- Performance Monitoring: Track average response times, resolution rates, or completion metrics
- Resource Utilization: Monitor asset usage, building occupancy, or equipment availability
- Compliance Reporting: Measure adherence to SLAs, response time targets, or regulatory requirements
Metrics are defined once and then automatically collected at scheduled intervals (daily, weekly, or monthly). The collected data can be visualized on Home Pages using widgets.
Accessing Metrics
To access the Metrics configuration:
- Navigate to Settings in the left sidebar
- Click Metrics
The Metrics page displays a list of all defined metrics with the following columns:
- Name: The metric's display name
- Description: Brief description of what the metric measures
- Execution status: Current status (
Success,Error, or empty if not yet run) - Last exec. date: Timestamp of the most recent data collection
- Active: Toggle indicating whether the metric is enabled
You can search, filter, and sort metrics using the column headers.
Creating a Metric
To create a new metric:
- Click the New Metric button (or similar action)
- Configure the metric using the Definition tab
- Optionally set target thresholds using the Target tab
- Click Save Changes
Definition Tab
The Definition tab contains the core configuration for your metric:
Basic Information
Name (required)
A descriptive name for the metric (e.g., "Requests by Type", "Buildings Count").
Description (optional)
Additional context about what the metric measures and its purpose.
Active
Toggle switch to enable or disable the metric. Disabled metrics will not collect data during scheduled runs.
Data Collection Settings
Recurrence (required)
How often the metric data should be collected:
- Daily: Collects data once per day
- Weekly: Collects data once per week
- Monthly: Collects data once per month
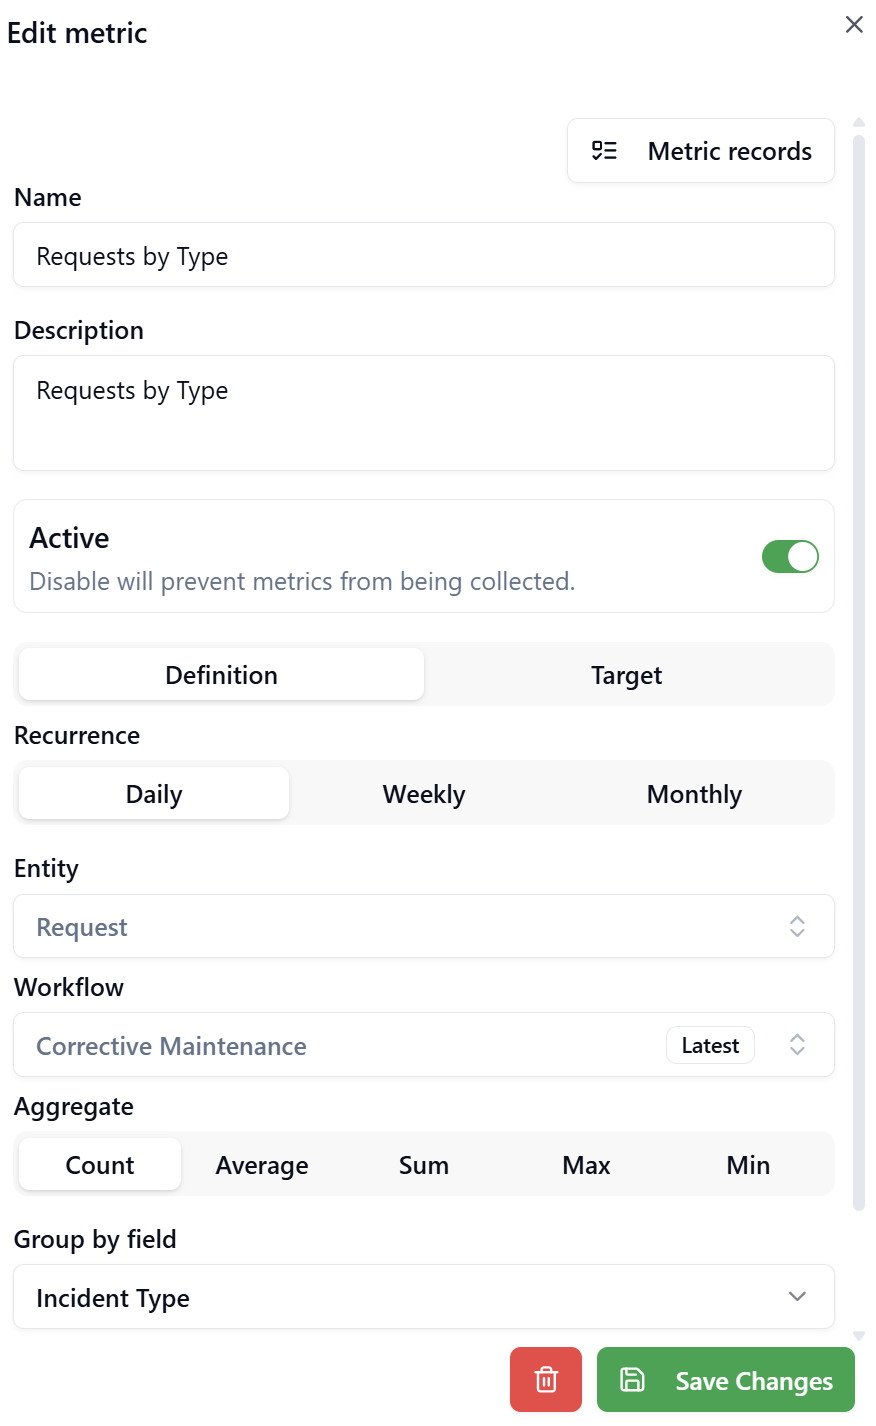
Entity (required)
The primary entity type to analyze. Available options include:
- Request: Workflow requests/instances
- Building: Building entities
- Location: Location entities
- Custom: Custom entity types you've defined
- Other entity types like Country, County, City, Property, Floor
Workflow Select a specific workflow to filter data. Required for Request entities.
Currently, metrics collect data only from the latest (published) version of the selected workflow. Support for aggregating data across multiple workflow versions is planned for a future release.
Aggregation and Grouping
Aggregate (required)
The calculation method to apply to the data:
- Count: Count the number of records
- Average: Calculate the mean value of a numeric field
- Sum: Calculate the total sum of a numeric field
- Max: Find the maximum value
- Min: Find the minimum value
Group by field (optional)
Field to group results by. For example:
- Group requests by
Incident Typeto see counts per category - Group by
Locationto see metrics by location - Group by
Statusto track workflow states
Formula (optional)
Select a specific field to use in calculations (for Average, Sum, Max, Min aggregates). For example:
Actual Costfor sum/average cost calculationsDurationfor time-based metrics- Custom numeric fields
Filter (optional)
Apply additional conditions to filter which records are included in the metric calculation. This allows you to focus on specific subsets of data.
Target Tab
The Target tab allows you to define threshold values for monitoring and alerting purposes:
Target (optional)
The desired or expected value for the metric. This serves as a baseline for comparison.
Limit high warning (optional)
Value at which a warning is triggered if the metric exceeds it.
Limit high critical (optional)
Value at which a critical alert is triggered if the metric exceeds it.
Limit low warning (optional)
Value at which a warning is triggered if the metric falls below it.
Limit low critical (optional)
Value at which a critical alert is triggered if the metric falls below it.
The alerting functionality based on these thresholds is planned for a future release. Currently, these values serve as reference points for manual review.
Viewing Metric Records
After a metric has been executed, you can view the collected data:
- In the Metrics list, click the three-dot menu (⋮) next to the metric
- Select Metric records
The Metric Records view displays historical data with columns:
- Group by: The grouping field name (e.g.,
problem_type) - Group by value: The specific value of the grouped field
- Value: The calculated metric value
- Date Collected: Timestamp when the data was collected
You can filter and search within the collected records to analyze trends over time.
Managing Metrics
Editing a Metric
To modify an existing metric:
- Click the three-dot menu (⋮) next to the metric
- Select Edit
- Update the Definition or Target settings
- Click Save Changes
Deleting a Metric
To remove a metric:
- Select the checkbox next to the metric(s) you want to delete
- Click Delete (n) button at the top of the list
- Confirm the deletion
Alternatively:
- Click the three-dot menu (⋮) next to the metric
- Select Delete
- Confirm the deletion
Deleting a metric will also remove all associated metric records (historical data). This action cannot be undone.
Best Practices
Start Simple
Begin with basic count metrics before moving to complex formulas and aggregations. This helps you understand the data collection patterns.
Use Descriptive Names
Name metrics clearly to indicate what they measure (e.g., "Open Requests by Priority" rather than just "Requests").
Set Appropriate Recurrence
Match the collection frequency to your business needs. Daily metrics are useful for operational monitoring, while monthly metrics work well for strategic KPIs.
Group Thoughtfully
Choose grouping fields that provide actionable insights. Grouping by status, type, or location typically reveals useful patterns.
Document Your Metrics
Use the Description field to explain the metric's purpose, calculation method, and any important context for future reference.
Monitor Execution Status
Regularly check the Execution status column to ensure metrics are collecting data successfully. Address any errors promptly.
Troubleshooting
Metric shows 'Error' execution status
Possible Causes:
- The selected workflow no longer exists or is unpublished
- The entity type or fields used in the metric definition have been modified or removed
- Filter conditions reference invalid fields or values
- Database connectivity issues during metric execution
Resolution:
- Open the metric in edit mode and verify all configuration settings
- Ensure the selected workflow exists and is published
- Verify that all referenced fields (Group by, Formula, Filter) are valid for the selected entity type
- Check the metric records view to see if partial data was collected
- Try re-running the metric manually (if manual execution is available)
- Contact your system administrator if the error persists
No data appearing in Metric records
Possible Causes:
- The metric has not executed yet (check Last exec. date)
- The metric is disabled (Active toggle is off)
- Filter conditions are too restrictive, excluding all records
- No matching records exist for the specified entity and workflow combination
- The metric was just created and awaiting the next scheduled collection
Resolution:
- Verify the Active toggle is enabled
- Check the Last exec. date to confirm execution has occurred
- Review the Filter settings to ensure they're not excluding all data
- Confirm that records exist matching your entity/workflow selection
- Wait for the next scheduled collection based on the Recurrence setting
- Review the Execution status for error messages
Metric records show unexpected values
Possible Causes:
- Incorrect aggregate function selected
- Grouping by a field that contains unexpected values
- Formula field contains non-numeric data
- Multiple workflow versions creating duplicate counts (current limitation)
- Filter conditions not properly excluding unwanted records
Resolution:
- Verify the Aggregate function matches your intended calculation
- Check the Group by field to ensure it's the correct field
- If using Average/Sum/Max/Min, confirm the Formula field contains numeric data
- Review the raw metric records to identify patterns in the data
- Adjust the Filter to exclude outliers or invalid records
- Consider creating separate metrics for different data subsets
Cannot select a specific workflow in metric definition
Possible Causes:
- No workflows exist for the selected entity type
- All workflows for the entity are in Draft status (unpublished)
- User permissions don't allow viewing the available workflows
Resolution:
- Verify that published workflows exist for your selected entity type
- Navigate to the Workflow section to check workflow status
- Ensure at least one workflow version is published (not Draft)
- Contact your system administrator if you should have access to specific workflows
Frequently Asked Questions
Q: Can I manually trigger a metric to collect data immediately?
A: Yes. You can manually collect metric data by selecting one or more metrics from the list (using the checkboxes) and clicking the Collect selected metrics button at the top of the page. This will immediately execute the selected metrics and update their data, without waiting for the next scheduled recurrence interval.
Q: How long is metric data retained?
A: Metric records are retained indefinitely unless the metric is deleted. There is currently no automatic data retention policy or archival process.
Q: Can I export metric records to Excel or CSV?
A: Direct export from the Metric records view is not currently available. However, you can display metrics on Home Page widgets and export data from those visualizations.
Q: Can I create calculated metrics that combine multiple metrics?
A: Not at this time. Each metric operates independently with its own data collection and calculation. Support for derived metrics and cross-metric formulas is planned for future releases.
Q: Will metrics work with archived or historical workflow versions?
A: Currently, metrics only collect data from the latest published workflow version. Support for analyzing data across multiple workflow versions (including historical versions) is planned for a future release.
Q: What happens if I change a metric's definition after data has been collected?
A: Existing metric records are not recalculated or modified. The new definition will apply to future data collection only. Consider creating a new metric with a different name if you need to preserve historical data with the old definition.