Management Consoles
Overview
Management Consoles provide a centralized interface where users can view and initiate workflow processes (requests) within the SignalSync platform. Once workflows are published, administrators or power users with access to the Graphical Workflow Engine application can define consoles that determine which processes are available to specific users.
The visibility of requests in Management Consoles is controlled by GWE (Graphical Workflow Engine) roles. Users will only see requests if they are:
- Involved in the process and need to perform an action
- Have performed an action in the past on that request
Console Types
SignalSync supports two types of Management Consoles, each designed for different use cases:
Requestor Console
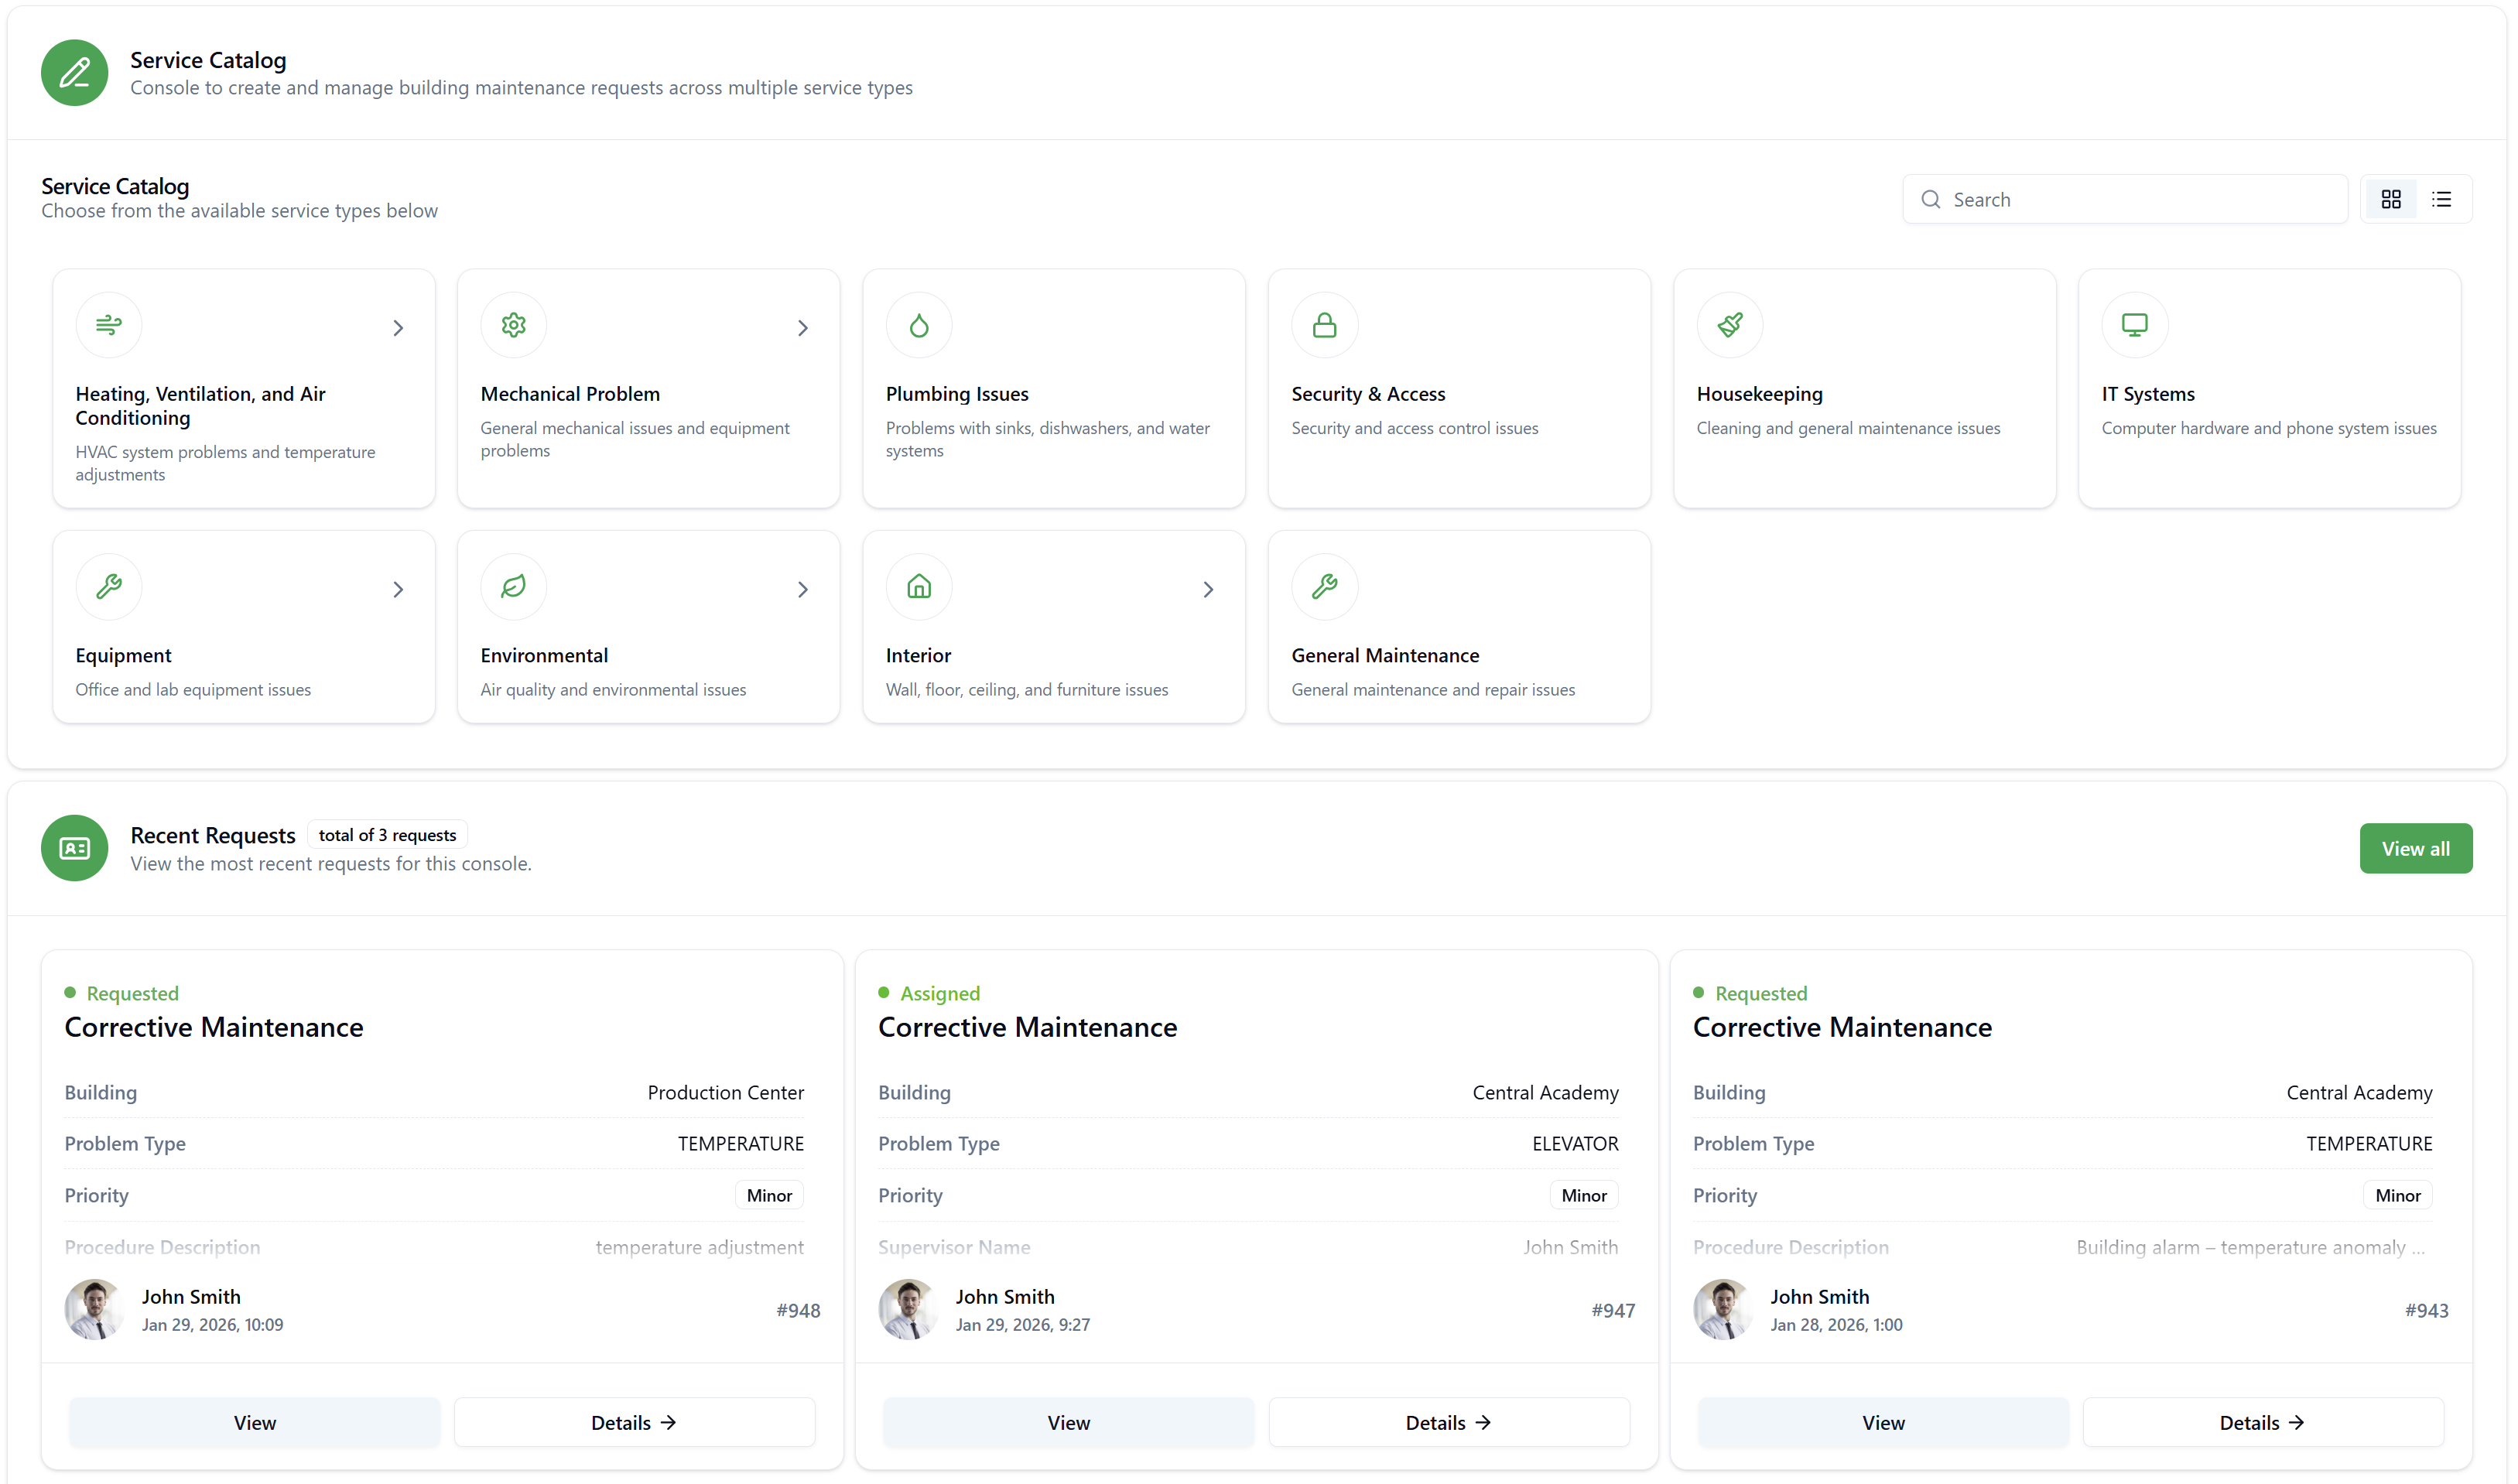
A Requestor Console is designed for end users who need to create and track their own service requests. It includes:
- Service Catalog section - Browse and initiate requests from available service types
- Recent Requests section - View and manage requests created or processed by the logged-in user
Management Console
A Management Console is designed for administrators, supervisors, or managers who need to oversee and process requests across multiple workflows. It includes:
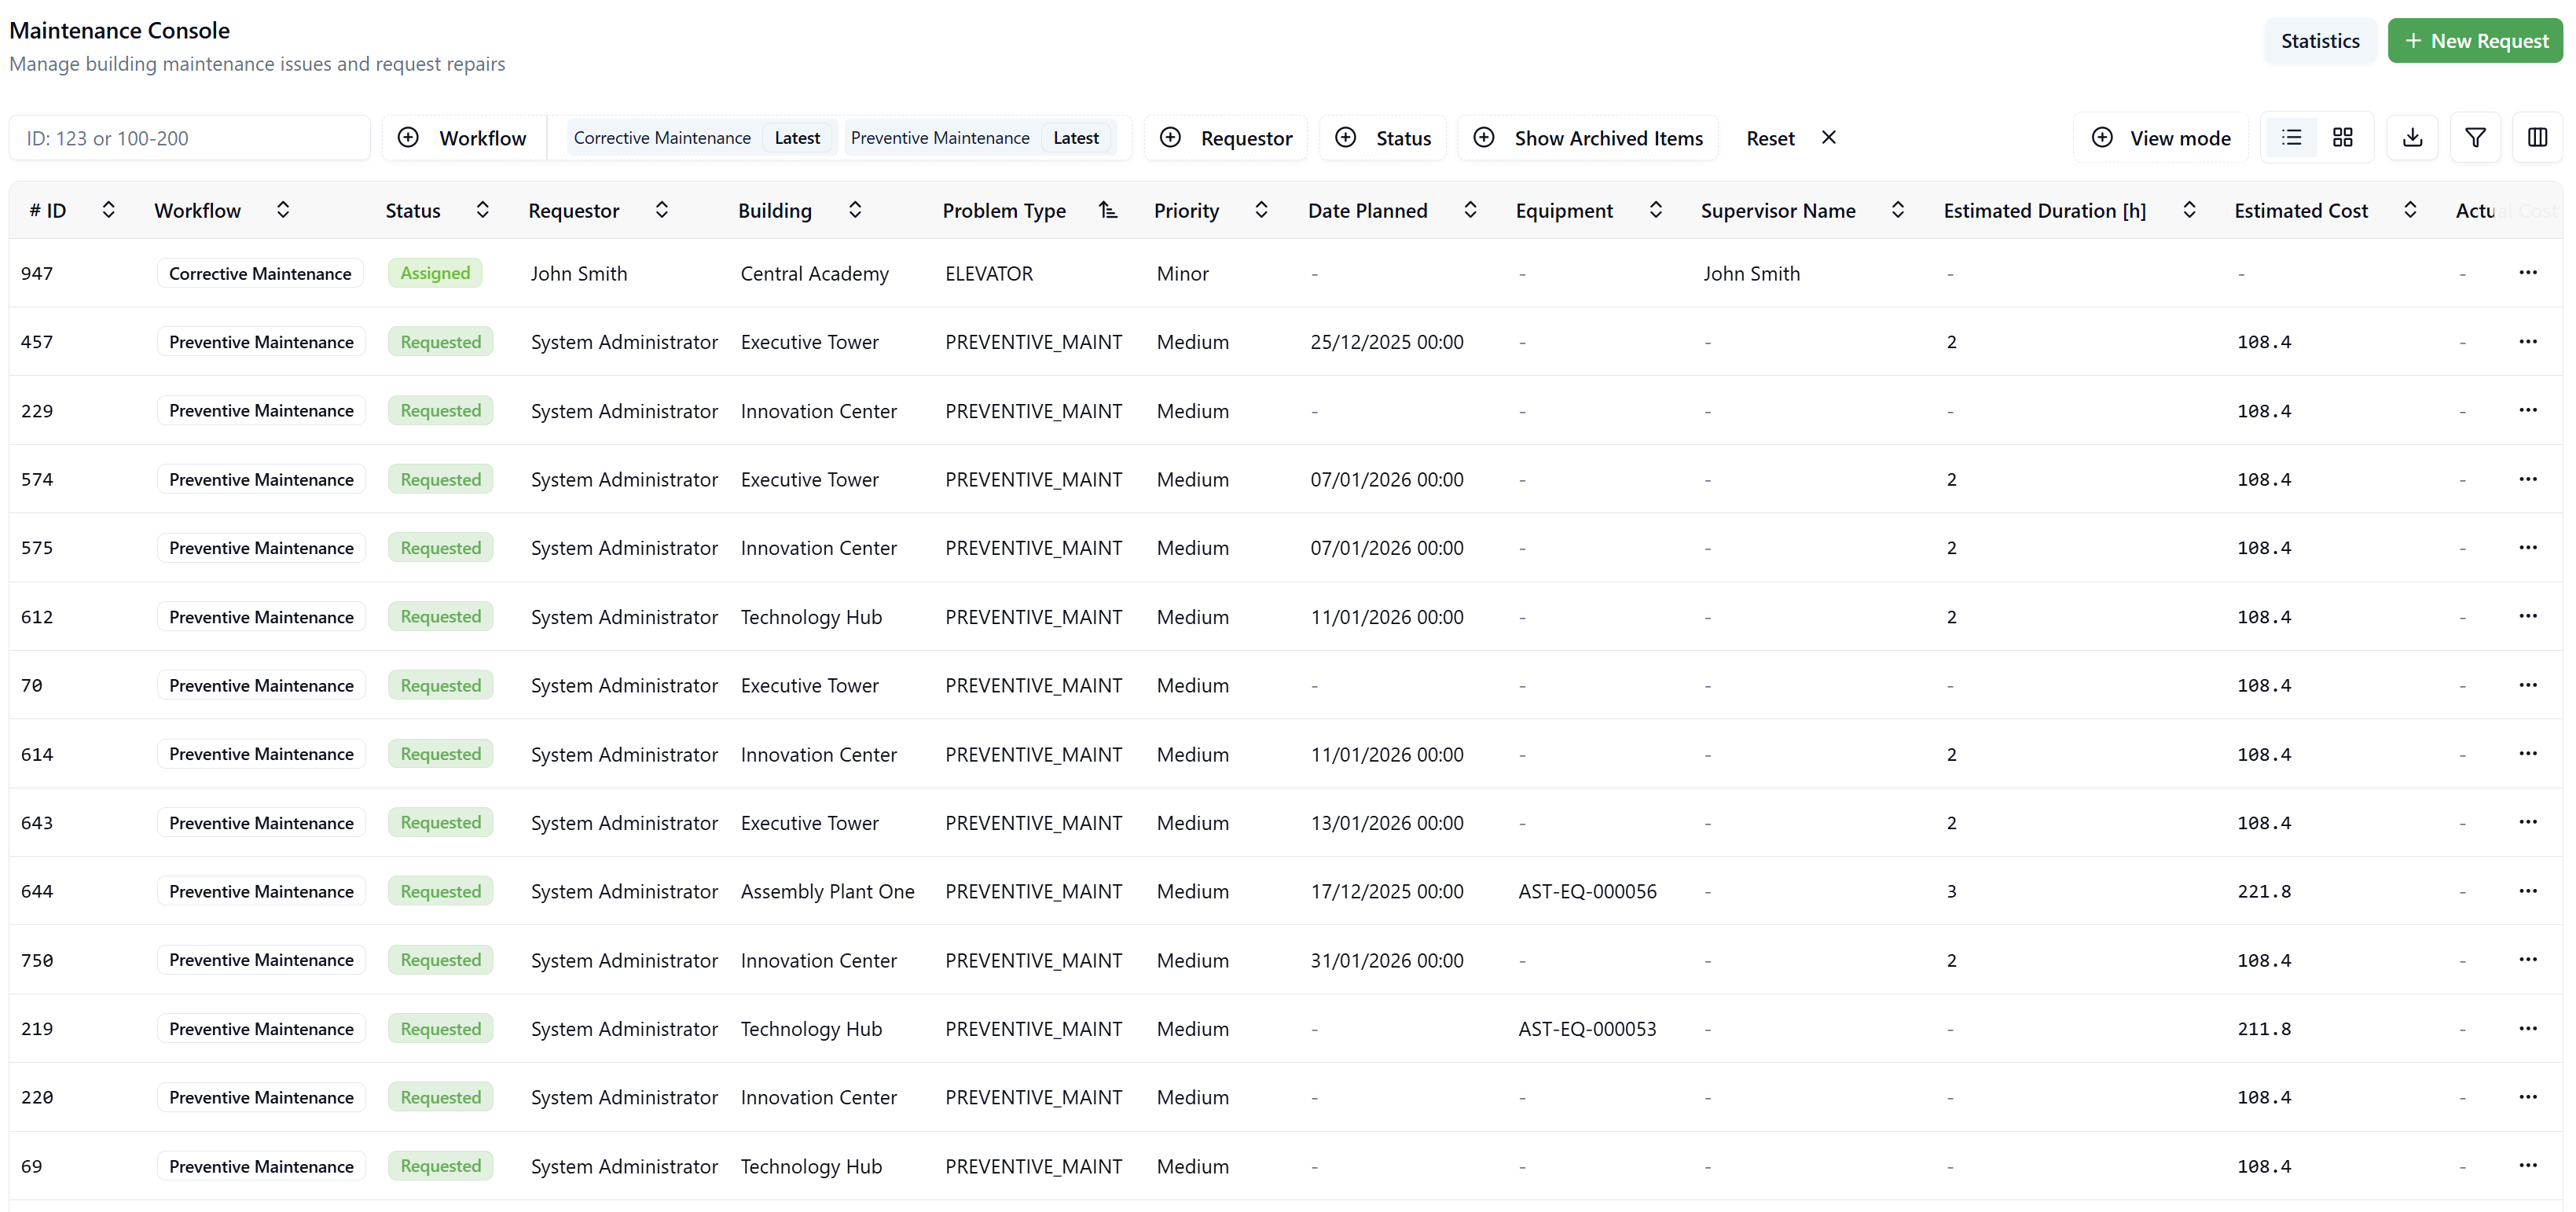
- New Request button - Directly initialize requests for specific workflows
- Request management interface - View, filter, and process requests based on assigned roles
- No Service Catalog section (streamlined for management tasks)
Preventive Maintenance workflows typically cannot be initialized manually through the New Request button, as they are generated automatically by the system based on predefined schedules.
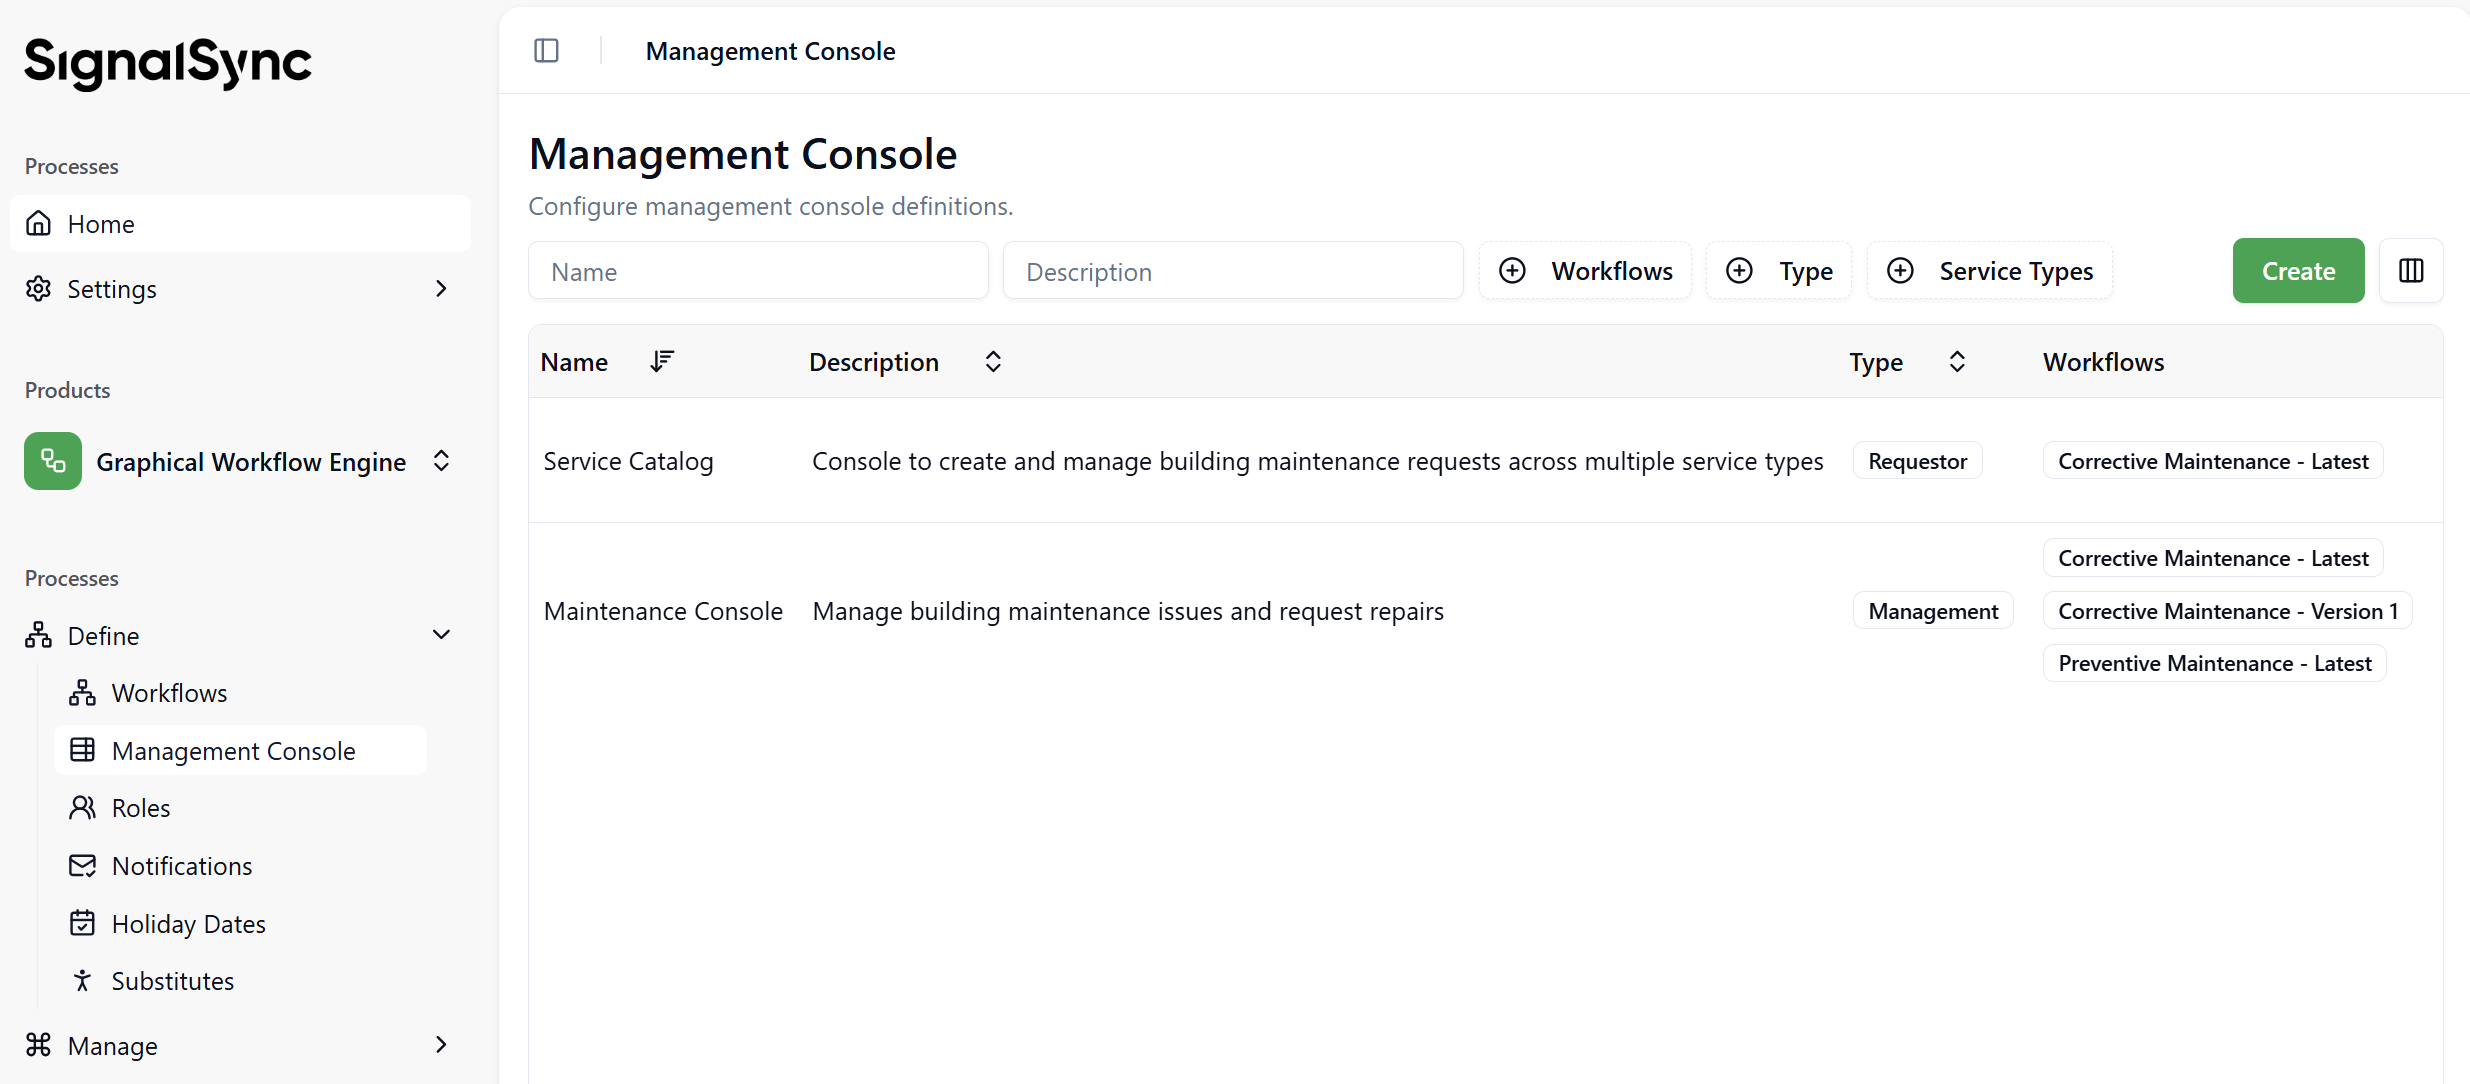
Configuring a Management Console
Management Consoles are configured in the Graphical Workflow Engine under Define > Management Console.
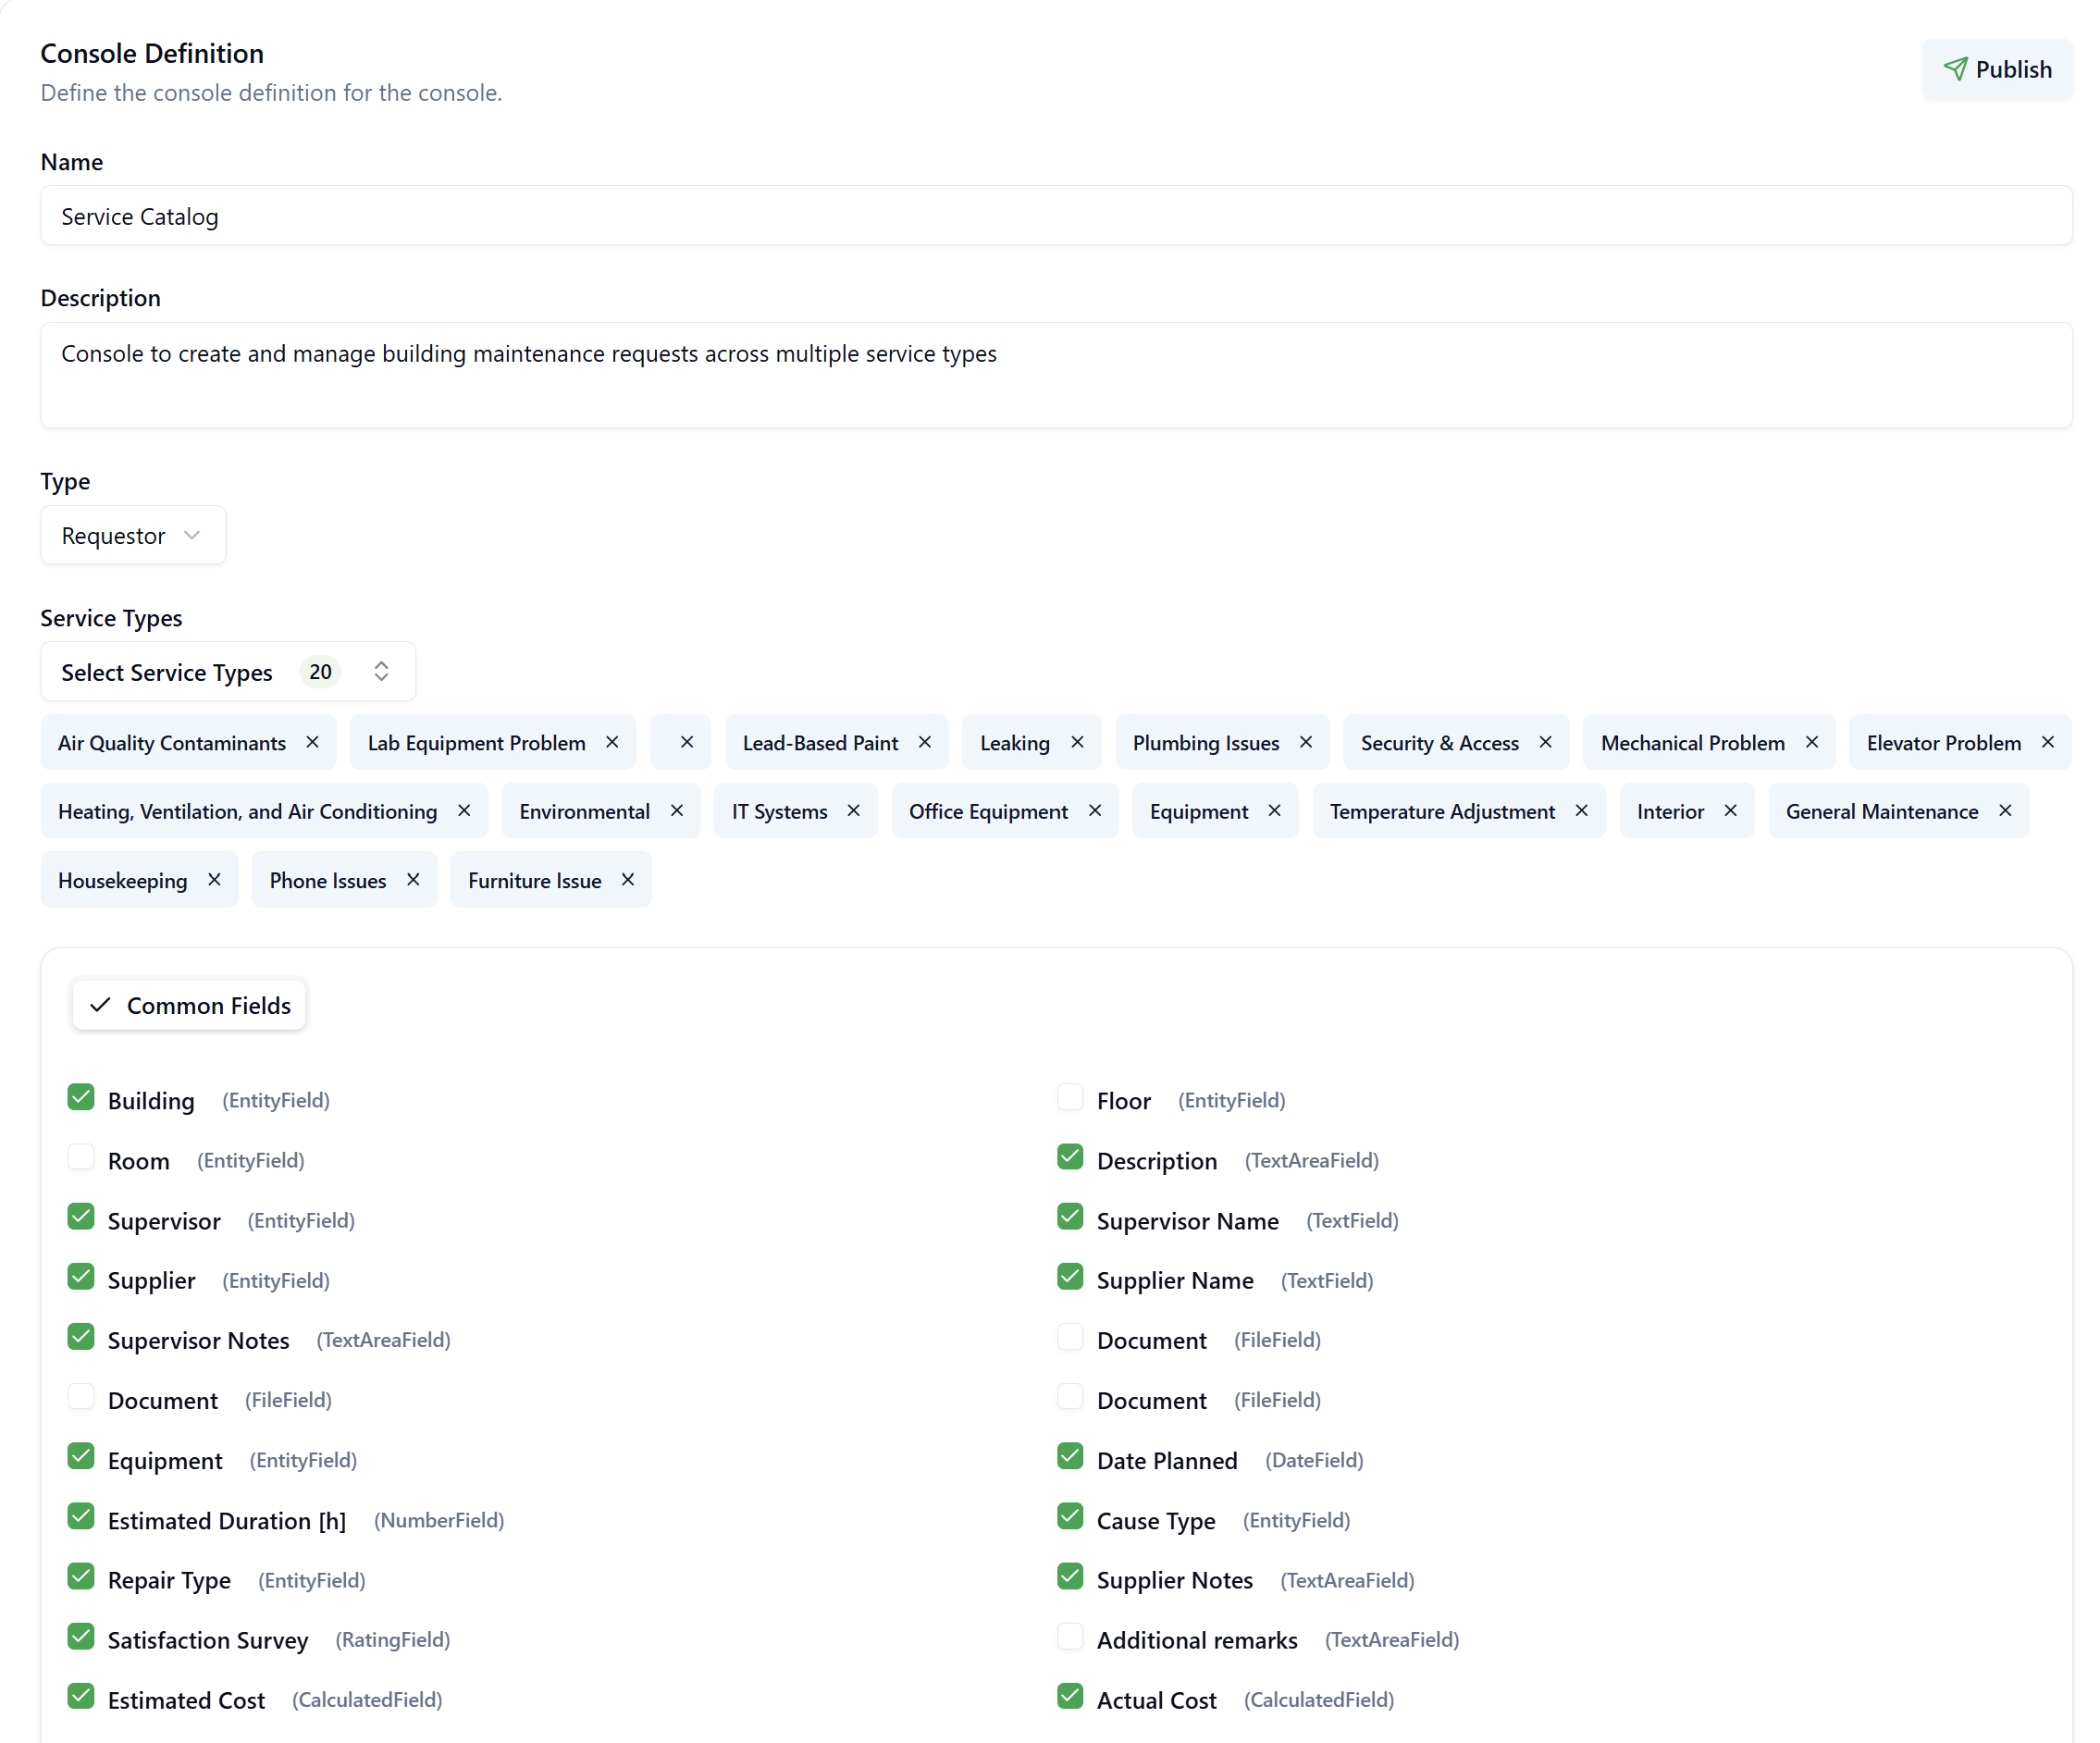
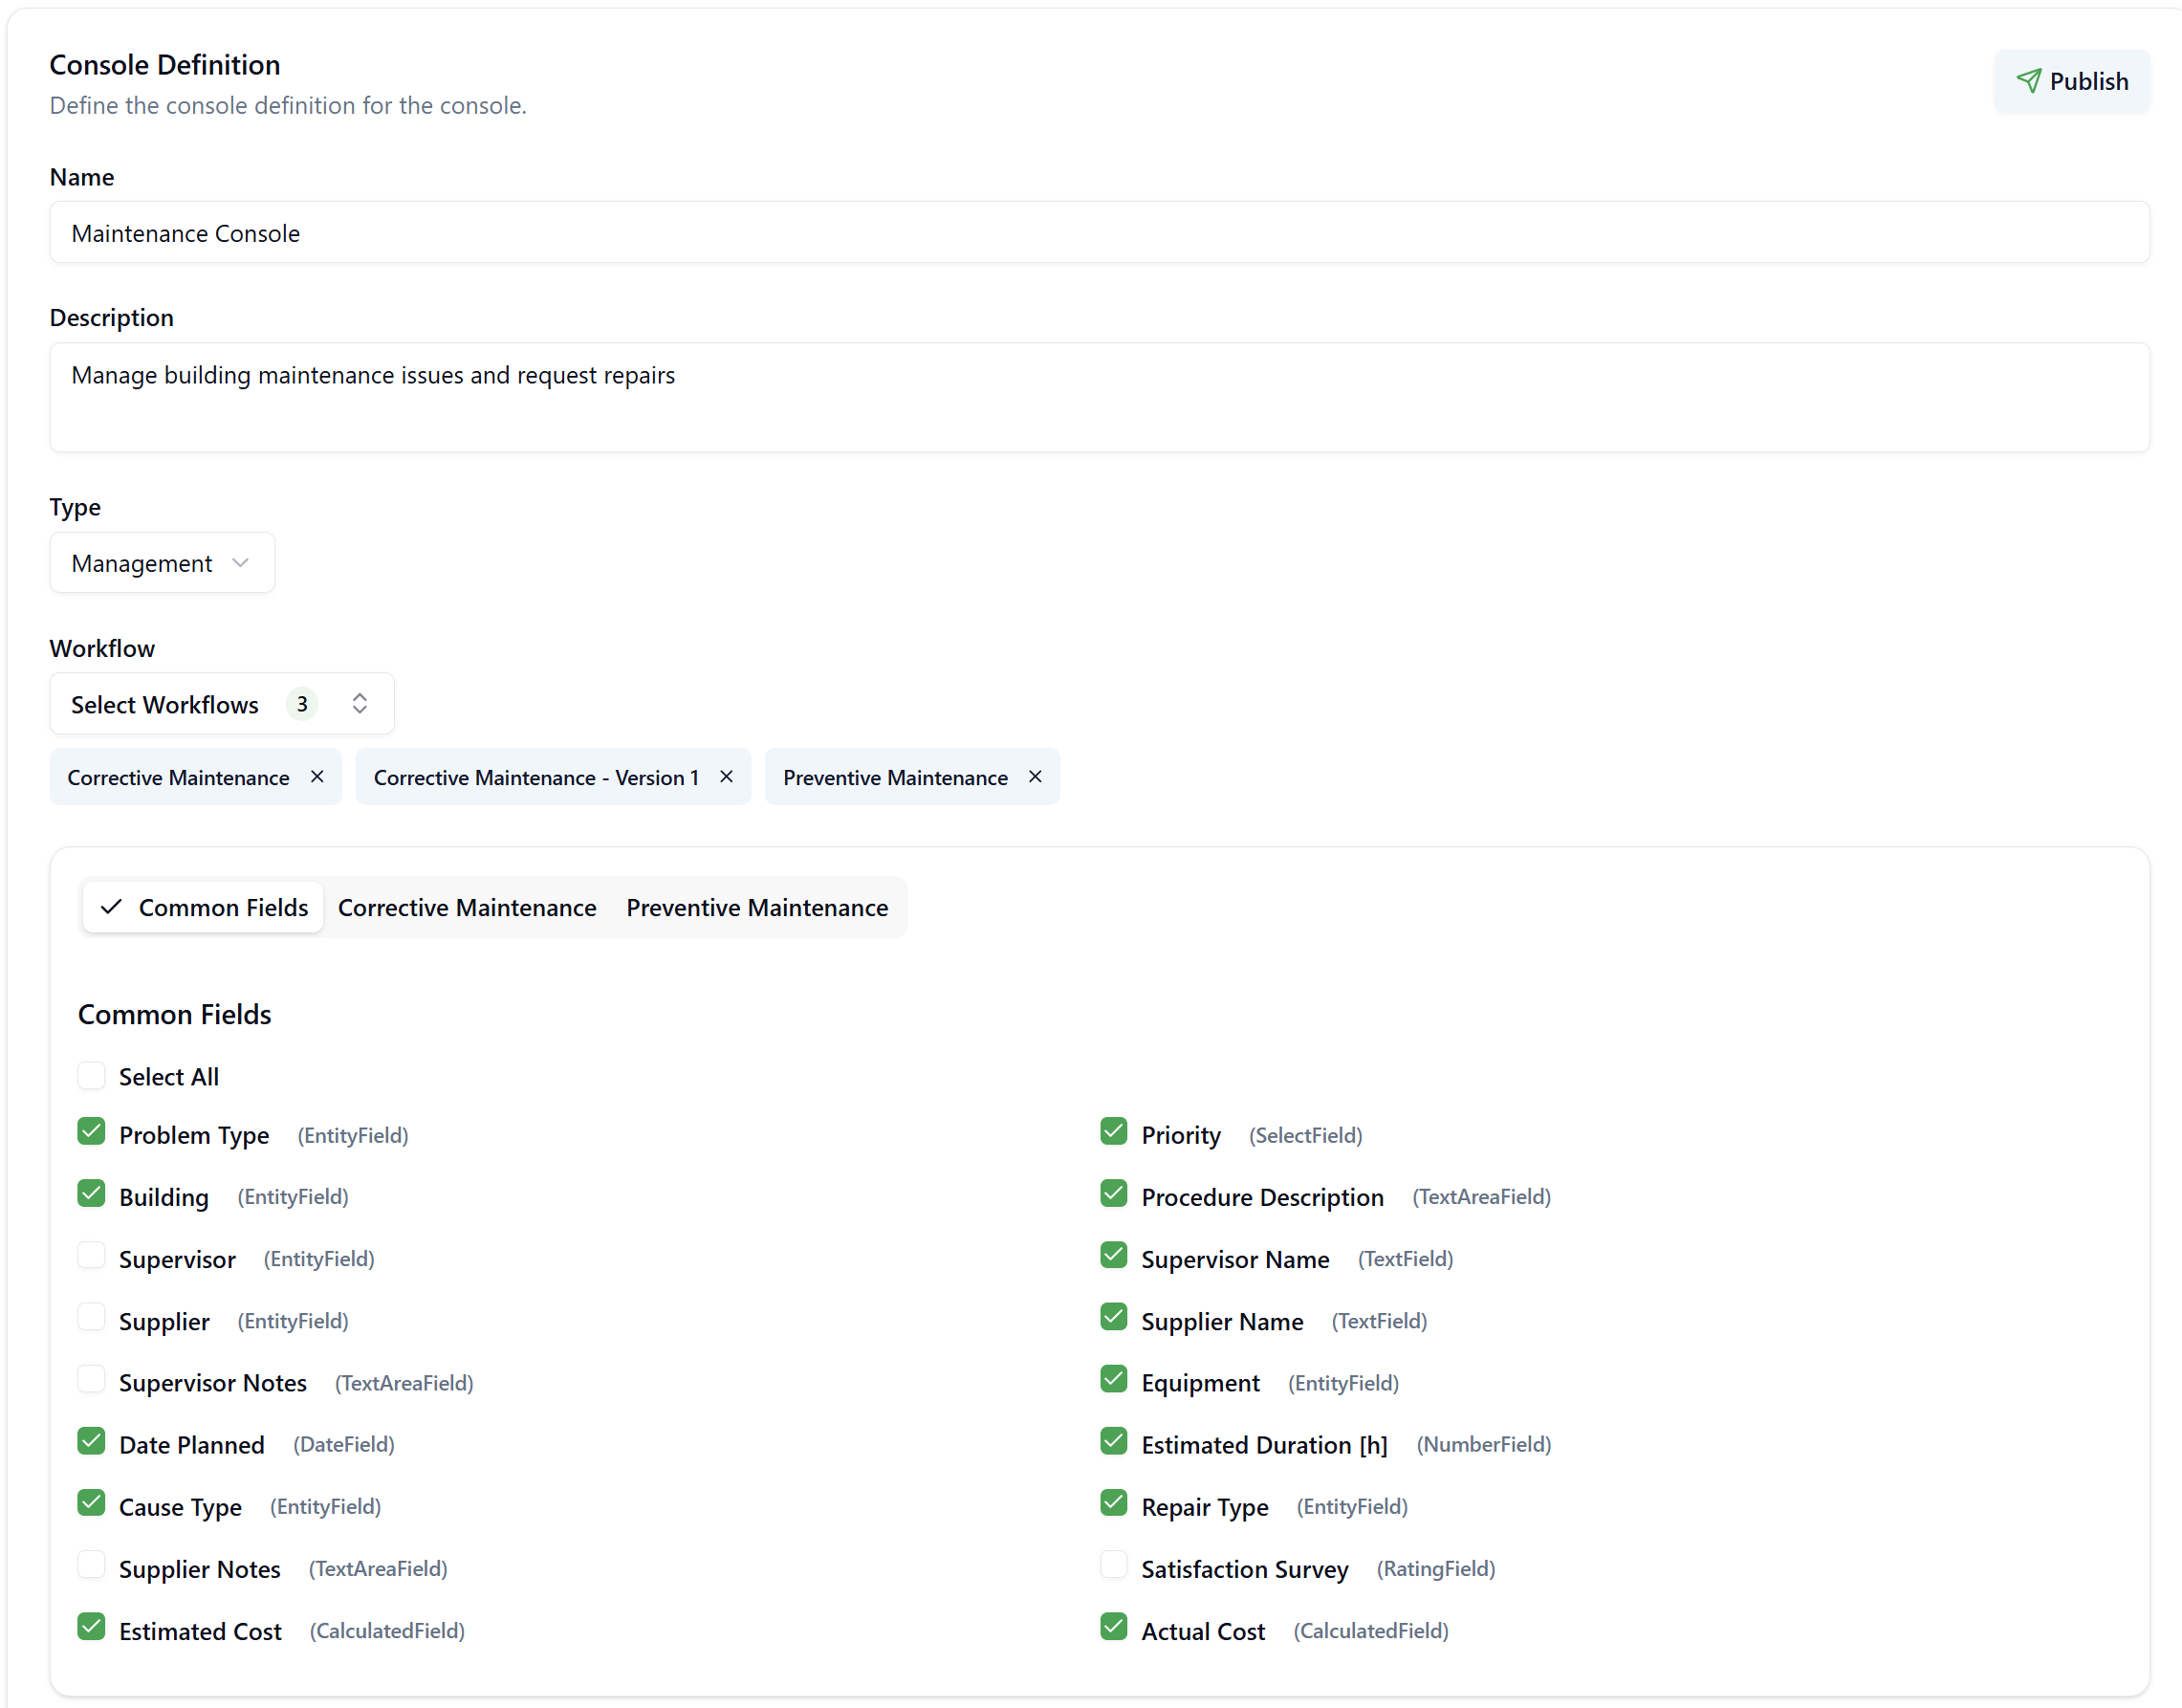
Basic Configuration
1. Name and Description
Provide a descriptive name and description for your console:
- Name: Identifies the console (e.g., "Service Catalog", "Maintenance Console")
- Description: Brief explanation of the console's purpose (e.g., "Console to create and manage building maintenance requests across multiple service types")
2. Select Console Type
Choose the console type based on your requirements:
- Requestor: For end users creating and tracking their own requests
- Management: For supervisors and administrators managing requests across workflows
Configuring Service Types (Requestor Console)
For Requestor type consoles, you select Service Types that determine which workflows are available in the Service Catalog.
Service Type Selection
- Click Select Service Types to open the service type picker
- Search and select one or more service types from the list
- Selected service types appear as tags above the Common Fields section
Service Types must be configured in Facility Maintenance app > Service Types with the "Publish in Service Portal" checkbox enabled. This creates the link between a service type and its associated workflow.
How Service Types Work
When a user clicks on a service type in the Service Catalog:
- The system identifies the linked workflow
- The latest version of that workflow is initialized
- The user is presented with the appropriate form to complete the request
Configuring Workflows (Management Console)
For Management type consoles, you directly select workflows and their versions.
Workflow Selection
- Click Select Workflows to open the workflow picker
- Search and select one or more workflows
- For each workflow, select the version:
- Latest: Always use the most recent published version
- Version 1, 2, 3...: Use a specific version
Example Workflows:
- Corrective Maintenance - Latest
- Corrective Maintenance - Version 1
- Preventive Maintenance - Latest
You can include multiple versions of the same workflow in a single console. This is useful when managing requests across different workflow iterations or when specific versions are required for certain processes.
Configuring Fields
After selecting Service Types (Requestor) or Workflows (Management), you configure which fields appear in the console's list.
Common Fields
Common Fields are attributes that appear across all selected service types or workflows. These fields are derived from the published forms associated with the workflows.
To configure Common Fields:
- Navigate to the Common Fields tab
- Click Select All to enable all available fields, or
- Check individual fields to include them in the console
Workflow-Specific Fields
For workflows that include unique fields not shared across all workflows, you can configure workflow-specific fields in dedicated tabs.
To configure workflow-specific fields:
- Click on the workflow tab (e.g., "Corrective Maintenance", "Preventive Maintenance")
- Select the workflow version (if multiple versions are included)
- Check the fields specific to that workflow
Field Ordering
The order in which fields appear in the console can be customized using drag-and-drop functionality.
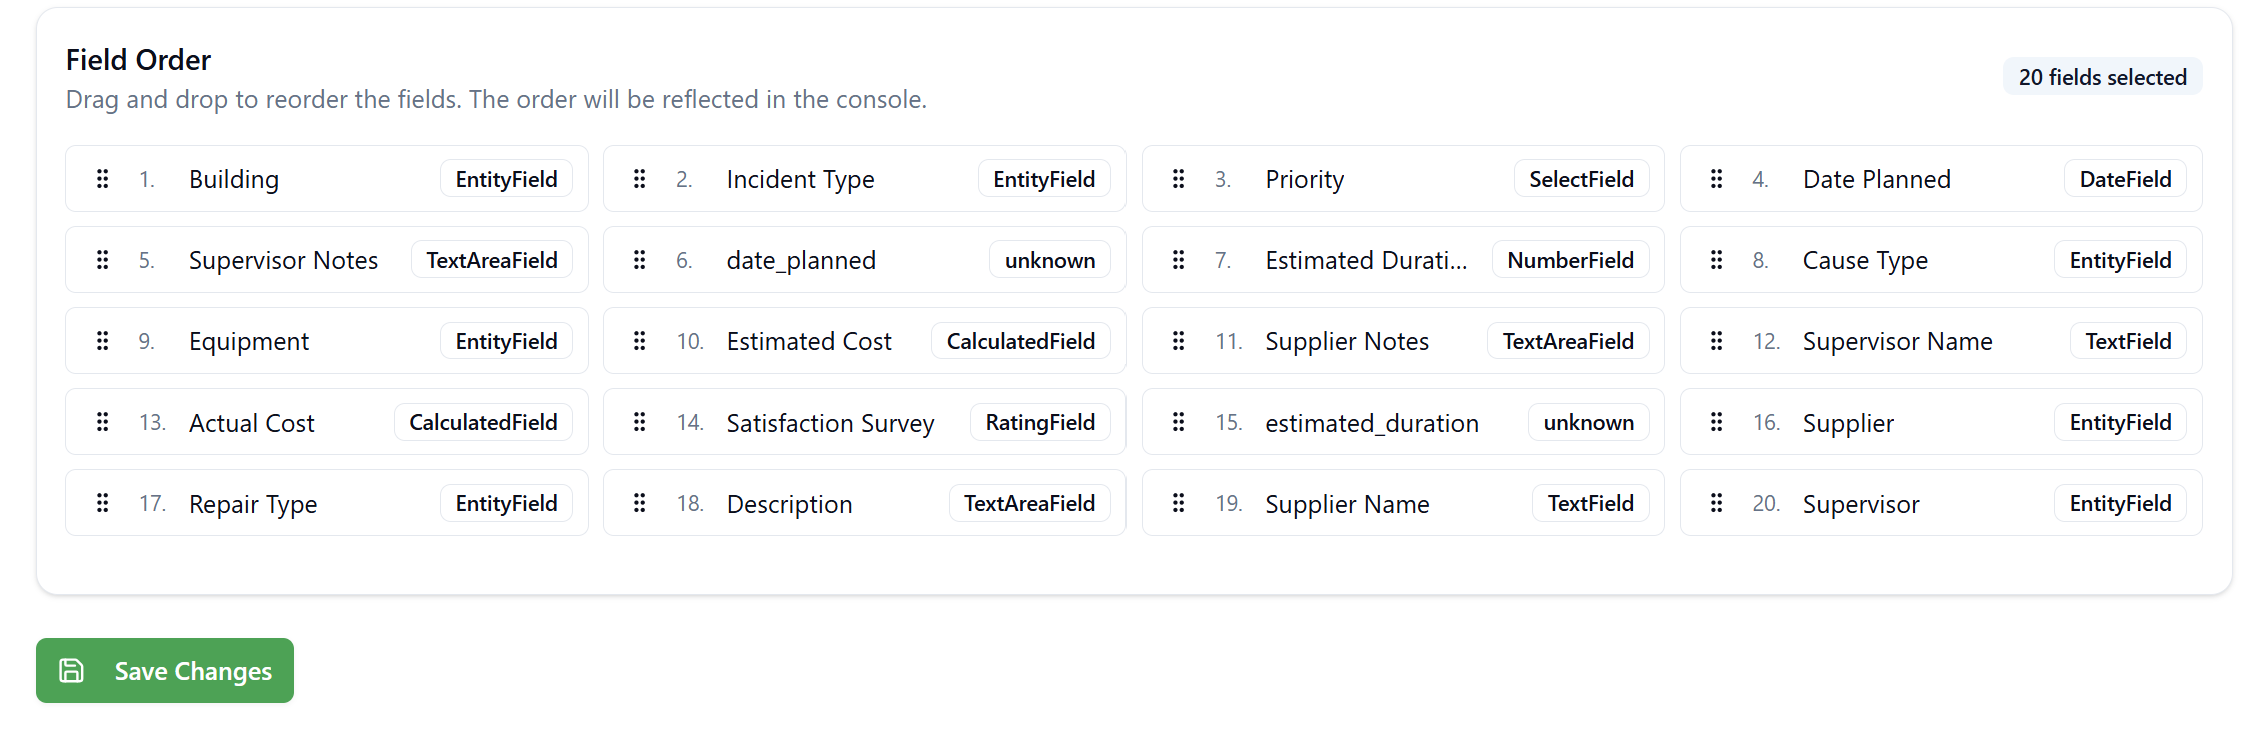
To Reorder Fields:
- Scroll to the Field Order section
- Drag fields using the handle (⋮⋮) on the left side
- Drop fields in the desired position
- Click Save Changes to apply the new field order
- The order will be reflected in the console after saving
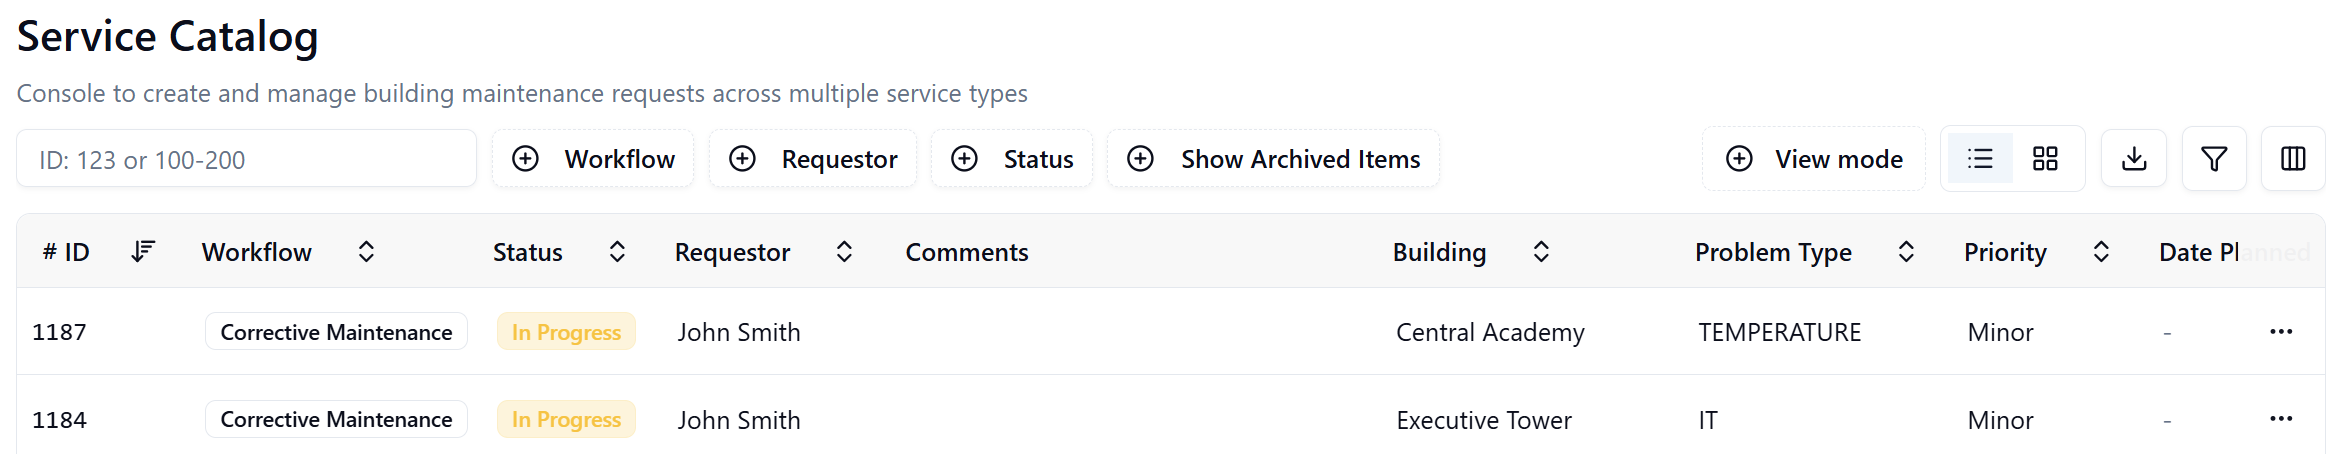
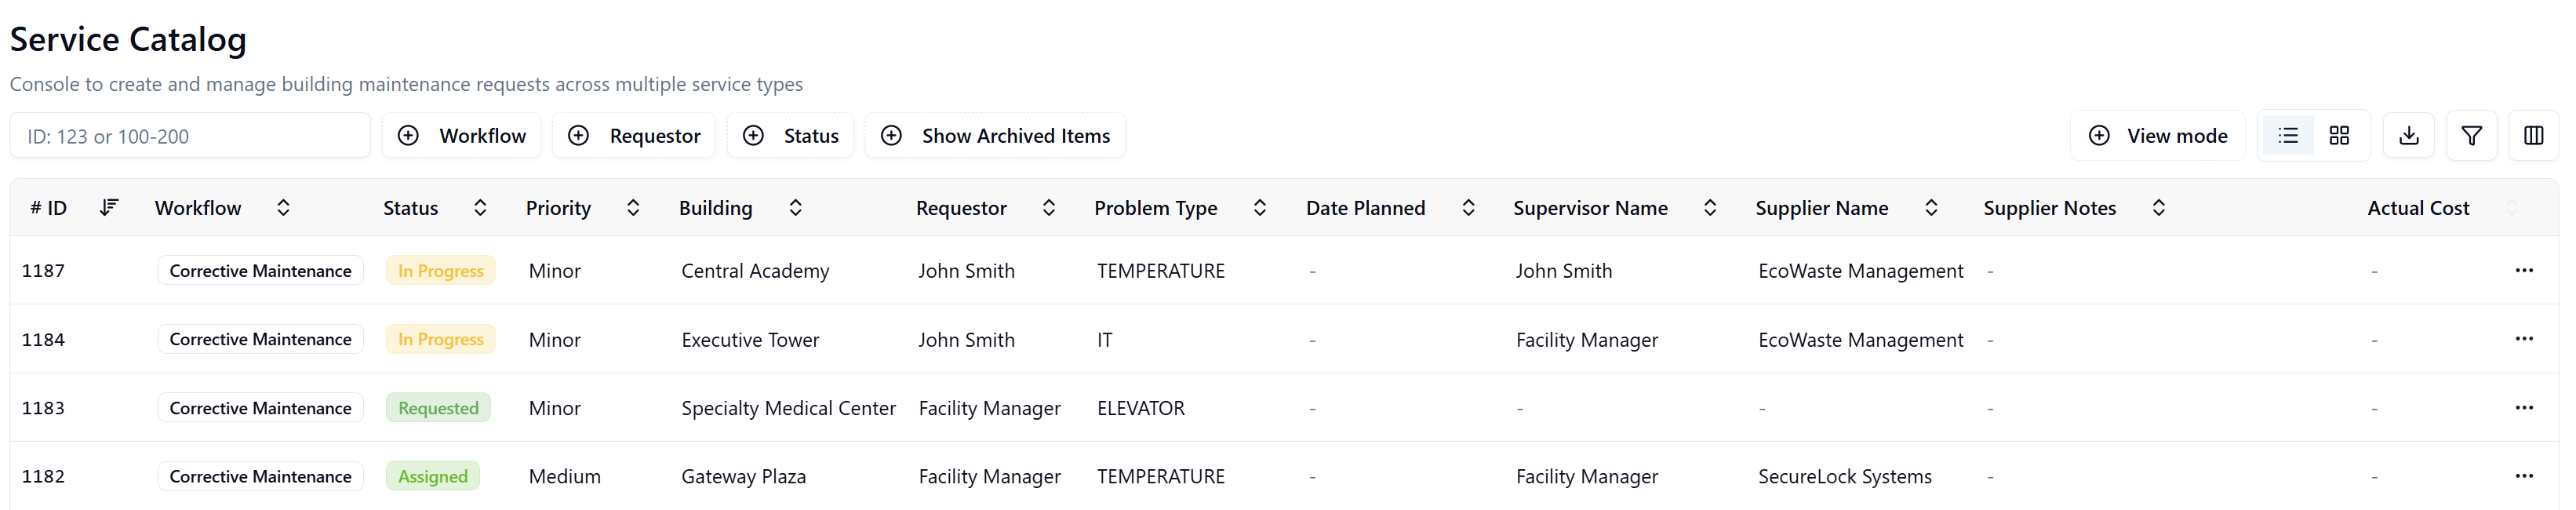
When the console is displayed in List View, the system shows: # ID, Workflow, Status, Comments, followed by the fields in the order configured in the Field Order section. Users can also hide and reorder columns directly in the console using the column visibility menu (columns icon with vertical lines) in the top-right corner.
Publishing a Console
Once a console is configured, it must be published to make it available in the application's navigation menu.
Publishing Process
- Click the Publish button in the top-right corner of the Console Definition screen
- Complete the publishing form:
Publishing Form Fields:
| Field | Description | Example |
|---|---|---|
| Process | Select the process category where the console will appear | Corrective Work |
| Name | The task name that appears in the navigation menu | Maintenance Console |
| Additional Languages | Provide translations for multi-language support | (Optional) |
| Description | Detailed description of the console (optional) | Please add a description |
| URL | Auto-generated URL path for the console | /apps/gwe/mng-console/2940f53f-55fa-4397-93de-64491dd5ef1b |
| Icon | Select an icon to represent the console in the menu | Select icon |
| Order | Display order in the navigation menu (lower numbers appear first) | 31 |
- Click Publish to make the console available
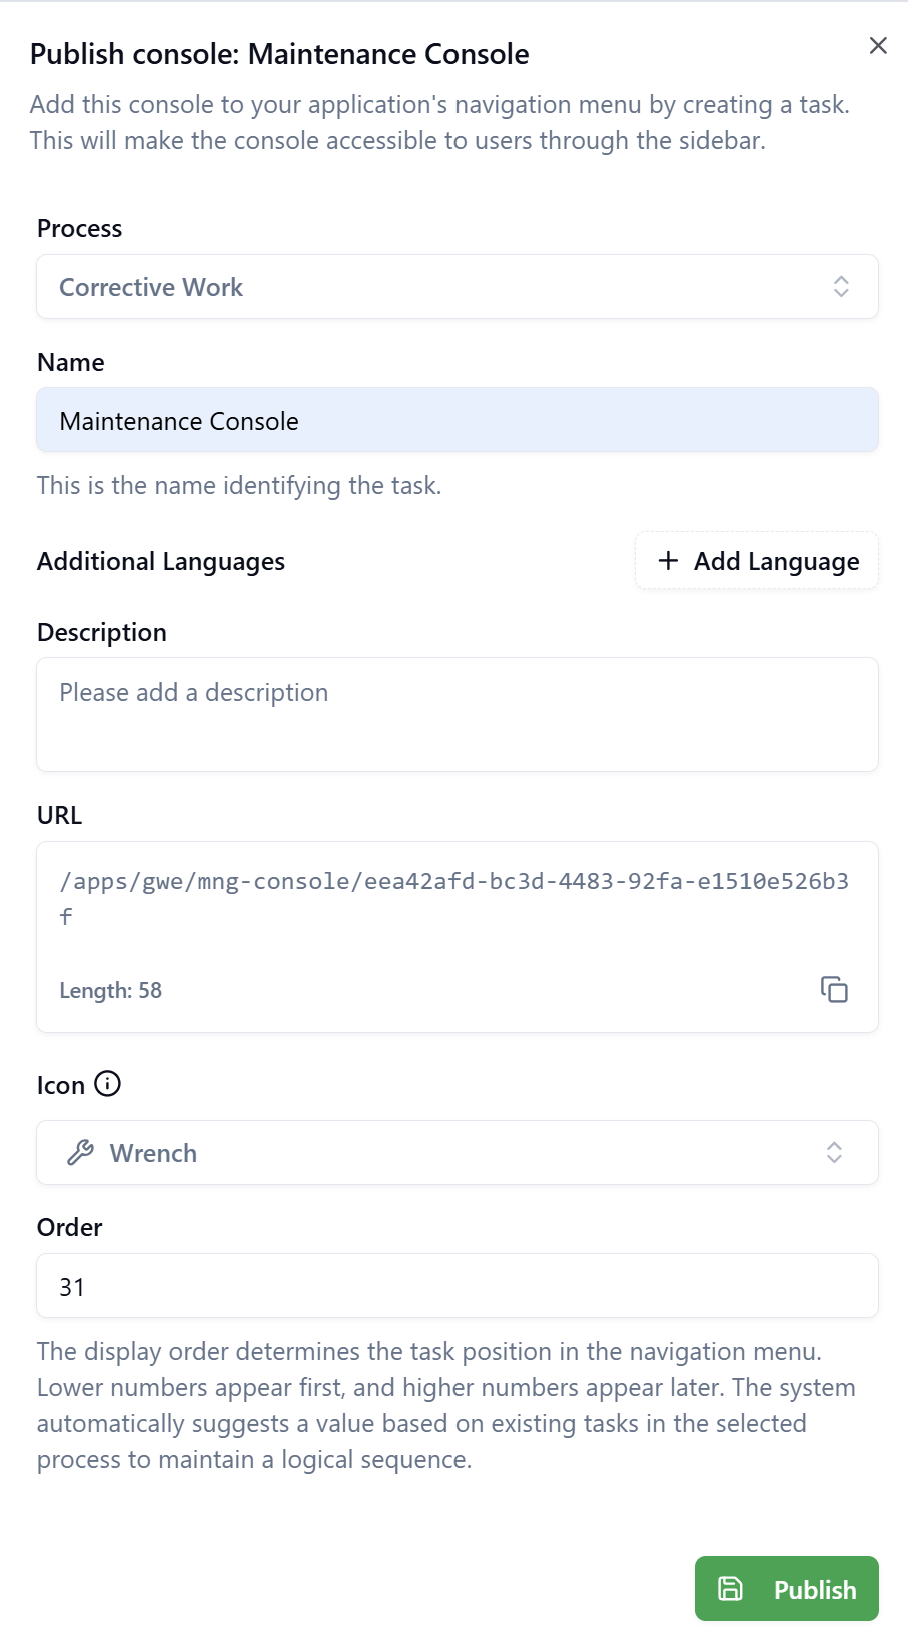
The order value determines the task's position in the navigation menu. Lower numbers appear first, and higher numbers appear later. The system automatically suggests values based on existing tasks in the selected process to maintain a logical sequence.
Navigation Integration
After publishing, the console appears in the application's sidebar under the selected process.
Example Navigation Structure:
Facility Maintenance
  └── Corrective Work
      ├── Report Incident (Requestor Console)
      ├── Maintenance Console (Management Console)
      └── Maintenance Portal
Saving Console Changes
If a console is already published but needs adjustments (e.g., adding service types, reordering fields), use the Save Changes button instead of republishing.
Save vs. Publish
| Action | Use Case |
|---|---|
| Save Changes | Update an existing published console (service types, workflows, field ordering) |
| Publish | Create a new console or republish after major configuration changes |
Use Save Changes for iterative improvements to avoid creating duplicate navigation entries.
Deleting a Console
Consoles can be permanently deleted from the system.
Deletion Process
- Scroll to the Danger Zone section at the bottom of the Console Definition screen
- Click Delete Console
- A confirmation dialog appears with the warning: "Are you sure absolutely sure? This will permanently remove the console and all associated configurations. This includes all versions, settings, and sharing permissions."
- Type the console name (e.g., "Maintenance Console", "Service Catalog") to confirm
- Click Delete
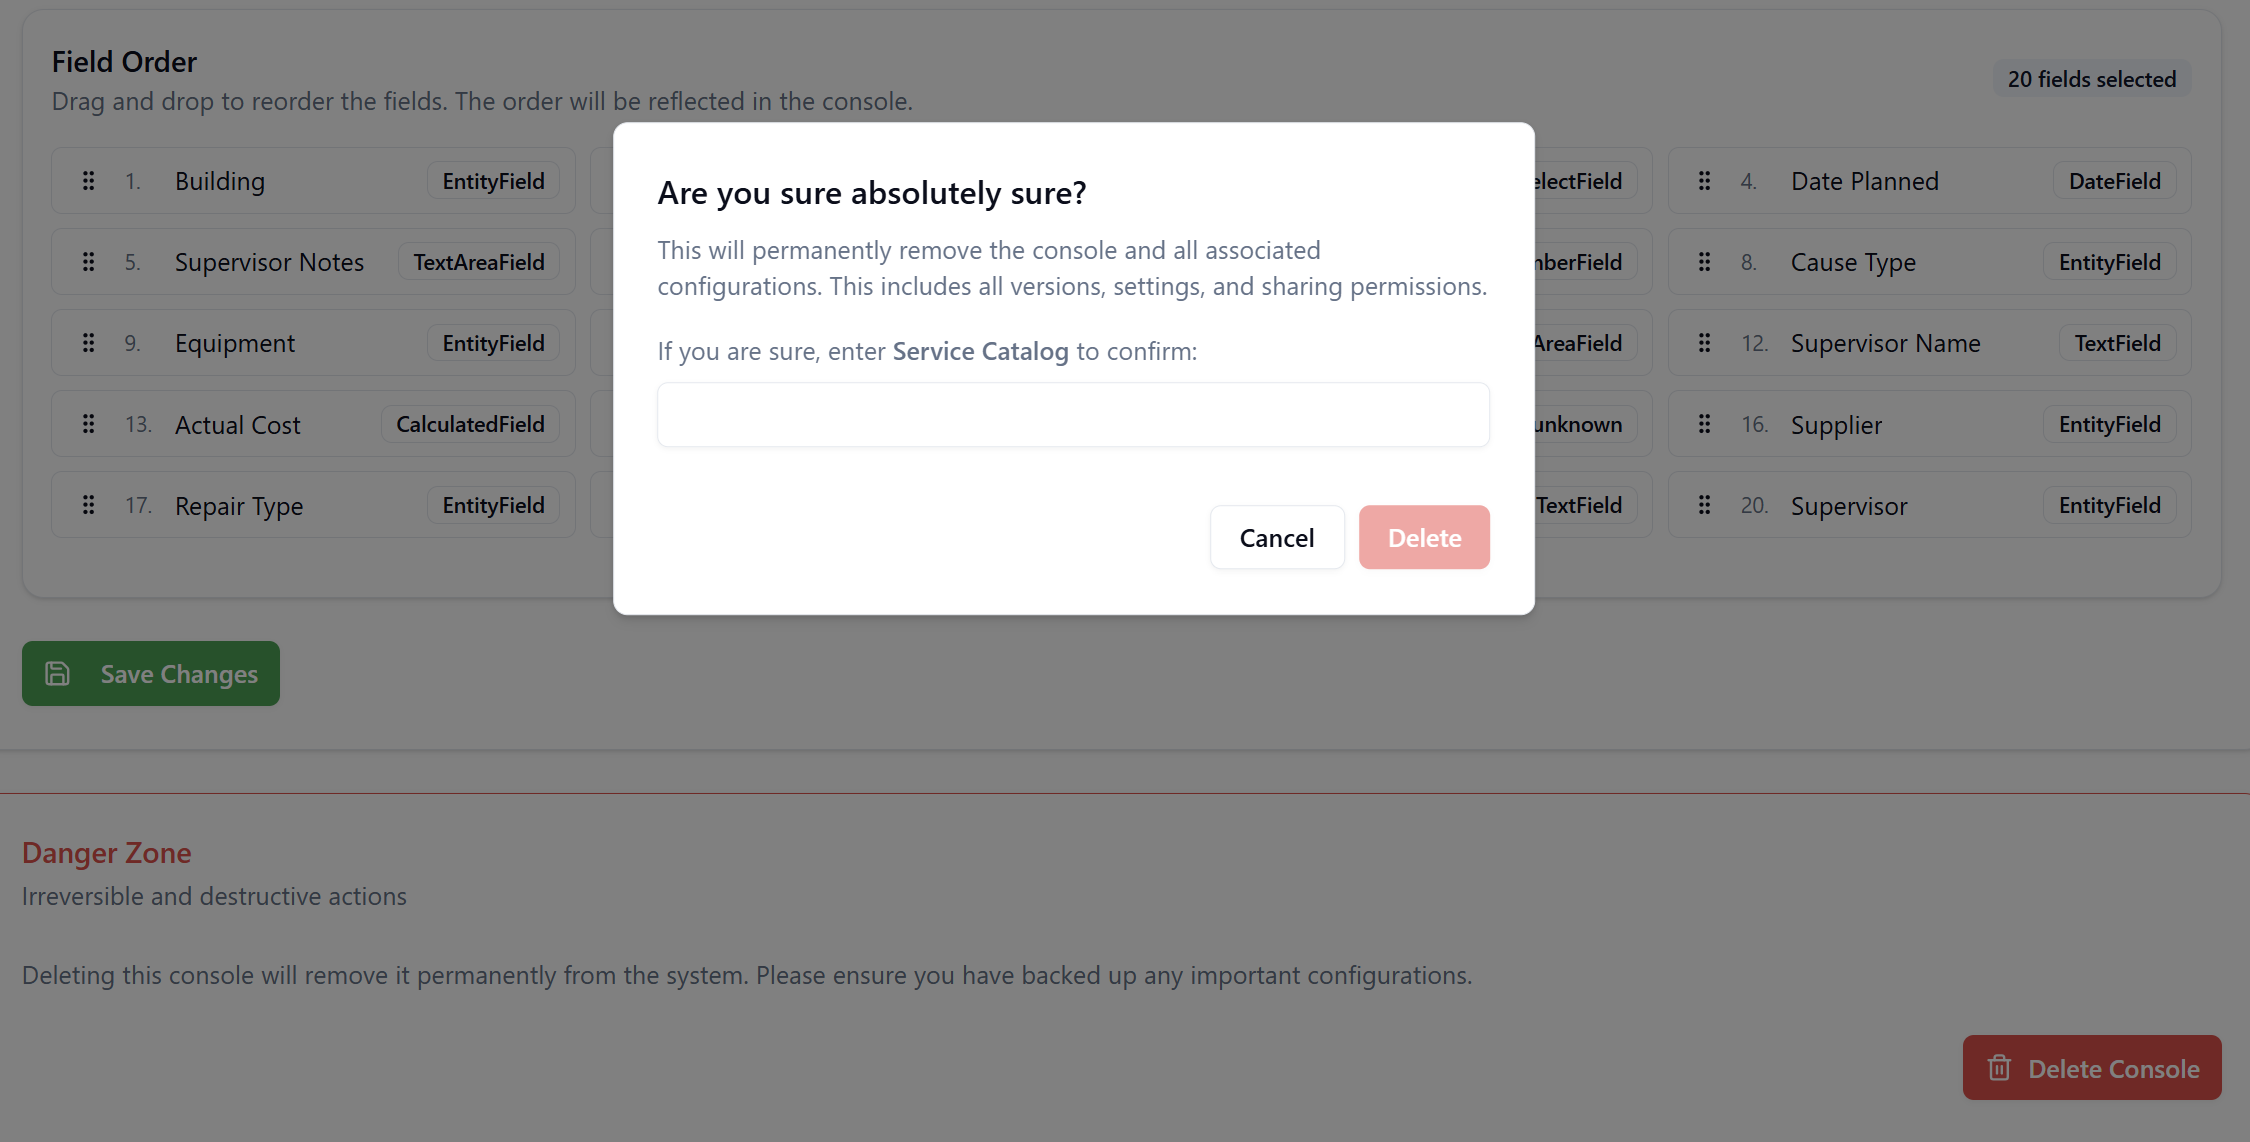
Deleting a console permanently removes it from the system, including all configurations, versions, settings, and sharing permissions. Ensure you have backed up any important configurations before deleting.
Using a Requestor Console
Requestor Consoles provide end users with a self-service interface to create and manage their requests.
Service Catalog
The Service Catalog section displays all available service types configured for the console.
Service Catalog Features:
- Grid or List View: Toggle between card-based grid view and list view using icons in the top-right corner
- Search: Find service types quickly using the search bar
- Service Type Cards: Each service type displays:
- Icon representing the service category
- Service type name (e.g., "Heating, Ventilation, and Air Conditioning")
- Brief description (e.g., "HVAC system problems and temperature adjustments")
Creating a Request from Service Catalog
- Click on a service type card
- The system opens the workflow form for that service type
- Complete the required fields
- Submit the request
Recent Requests
The Recent Requests section displays requests that the logged-in user has created or processed.
Recent Requests Features:
Display Modes:
- Card View: Shows requests as cards with key information
- List View: Shows requests in a tabular format with sortable columns
Actions per Request:
- View: Opens a popup (desktop) or drawer (mobile) showing a preview of the request
- Details: Opens the full request form with available actions based on workflow state
Request Actions
View Button: Opens a Request Information dialog showing basic information:
- Problem Type
- Building
- Priority
- Procedure Description
- Other key fields from the request
Details Button: Opens the full request form where users can:
- Perform workflow actions (Approve, Reject, Assign, etc.)
- View the complete request details
- Add comments
- Upload documents
- Update field values
Actions Menu (⋯): Click the three-dot menu in the top-right corner of a request to access:
- Reassign: Transfer the request to another user
- Cancel: Cancel the request
- Action Log: View the complete history of actions performed on the request
Only the primary workflow action (e.g., "Assign") is displayed on the main card/row. Regular actions and the Action Log are accessible through the ⋯ menu to keep the interface clean.
View All Requests
Click View all in the Recent Requests section to see all requests in a dedicated full-screen view with:
- Advanced filtering options
- Sortable columns
- Export capabilities
- Pagination controls
Using a Management Console
Management Consoles provide supervisors and administrators with a streamlined interface to manage requests across multiple workflows.
Key Differences from Requestor Console
| Feature | Requestor Console | Management Console |
|---|---|---|
| Service Catalog | ✅ Yes | ❌ No |
| New Request Button | ❌ No | ✅ Yes |
| Request Creation | Through Service Catalog | Direct workflow initialization |
| Primary Use Case | End user self-service | Administrative management |
Creating a Request in Management Console
- Click the + New Request button in the top-right corner
- Select the workflow from the dropdown menu (if multiple workflows are configured)
- The workflow form opens
- Complete the required fields
- Submit the request
When clicking New Request, the system uses the latest workflow version configured in the console definition.
Management Console Interface
The Management Console displays requests in a table with advanced filtering and management capabilities. The interface shows request ID, Workflow name, Status, Requestor, and all configured fields from the Field Order section.
Filtering and Searching
Both Requestor and Management Consoles provide powerful filtering capabilities to help users find specific requests.
Filter Options
Request ID Filter
Search by individual ID or ID range:
- Single ID:
123 - ID Range:
123-150or100-200
Workflow Filter
Filter by workflow name and version:
- Displays all workflows configured in the console
- Shows both workflow name and version (e.g., "Corrective Maintenance - Latest", "Corrective Maintenance - Version 1")
- Multiple workflows can be selected
Requestor Filter
Filter by the person who created the request:
- Search by user name
- Select from list of requestors
Status Filter
Filter by workflow status
Click multiple status badges to filter by several statuses simultaneously. For example, select both "Requested" and "Assigned" to see requests in either state.
Show Archived Items
Toggle to include or exclude archived requests:
- Show Archived Items (search box, default)
- Only Archived Items (archived only)
- All Items (both active and archived)
View Mode
The View Mode filter controls which requests are visible based on the user's relationship to the request.
View Mode Options:
| Mode | Description |
|---|---|
| My Requests | Requests created by the logged-in user |
| Delegated to me | Requests assigned to the logged-in user |
| All requests | All requests the user has permission to view based on GWE roles |
By default, Management Consoles typically display "All requests" while Requestor Consoles default to "My Requests".
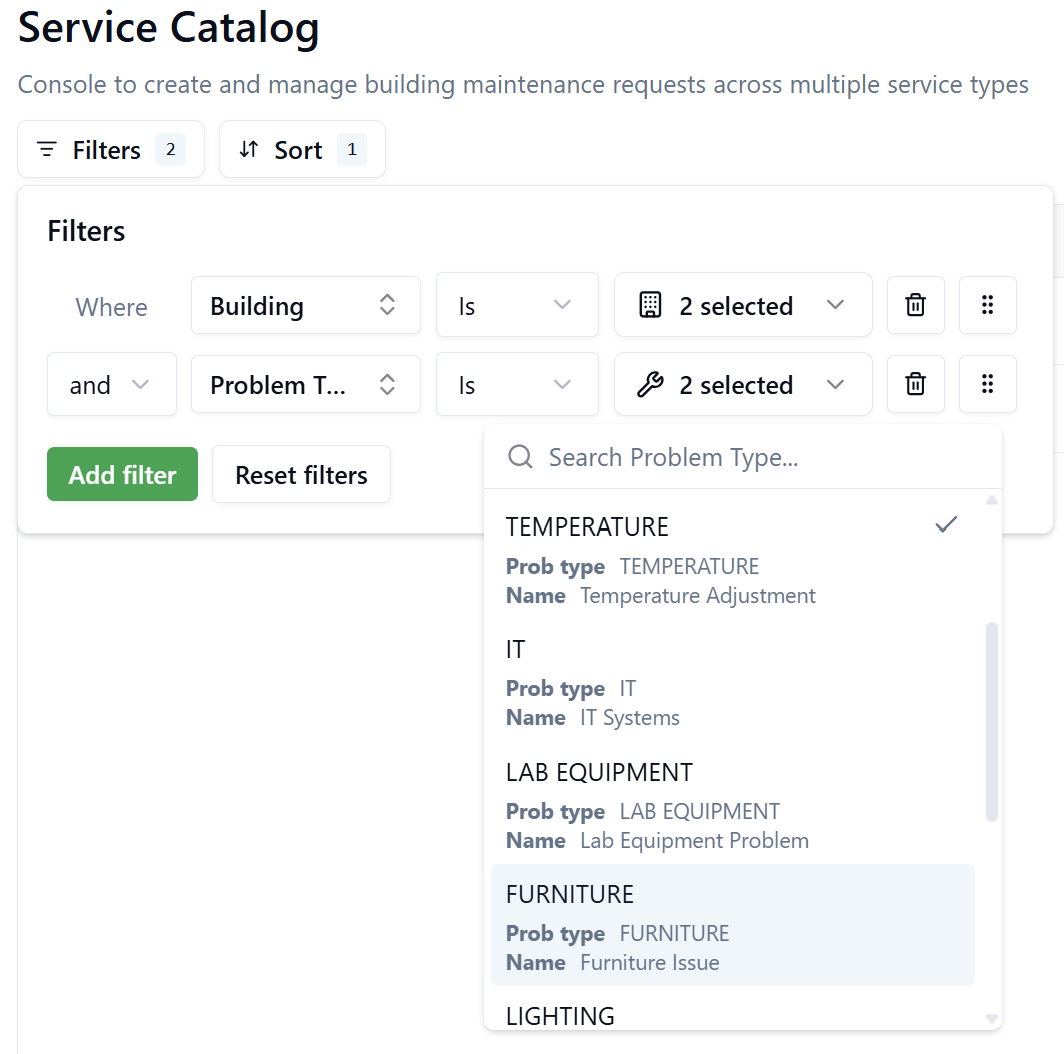
Advanced Filtering
Click the Filters button (funnel icon) on the right side of the toolbar to open the advanced filter panel on the left side of the screen.

Creating Filter Conditions
- Click Add filter to add a new condition
- Select a field from the dropdown (e.g., "Workflow", "Status", "Building")
- Select an operator (e.g., "Is", "Is not", "Contains")
- Enter or select the filter value
- Click Add filter again to add multiple conditions
Managing Filters
- Delete a filter: Click the trash icon next to the filter
- Reorder filters: Use the drag handle to change filter priority
- Reset all filters: Click Reset filters to clear all conditions
Sorting
Click the Sort button to configure sorting options.
Sorting Configuration
- Select the field to sort by (e.g., "Request id", "Date Created", "Status")
- Choose sort order:
- Asc: Ascending (A-Z, 0-9, oldest to newest)
- Desc: Descending (Z-A, 9-0, newest to oldest)
- Click Add sort to add additional sort levels
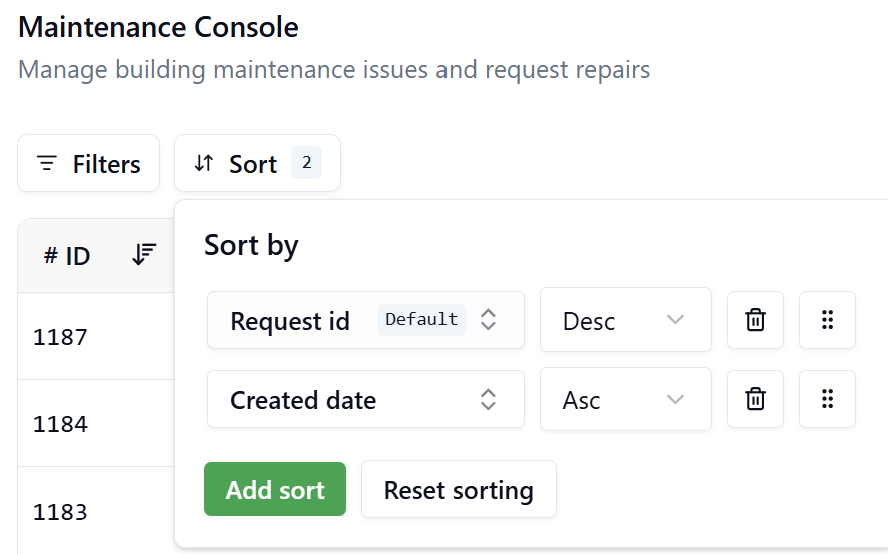
Add multiple sort criteria to create complex sorting logic. For example, sort by Status (Desc), then by Date Created (Asc) within each status group.
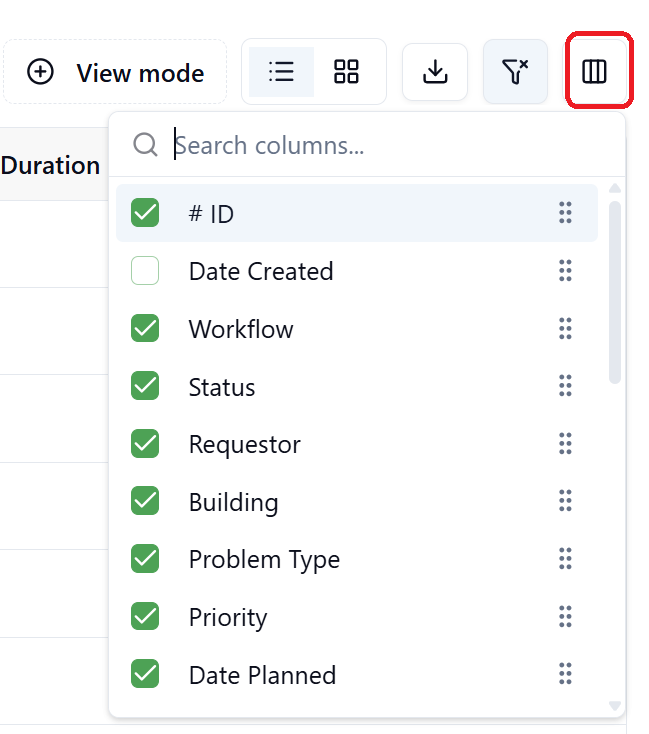
Column Visibility and Reordering
Customize which columns appear in the list view and their order.
Managing Column Visibility
- Click the column visibility icon (rightmost icon in the toolbar) to open the column configuration menu
- A dropdown panel displays all available columns with checkboxes
- Check the boxes next to columns you want to display in the list view
- Uncheck the boxes next to columns you want to hide
- Use the search bar at the top of the panel to quickly locate specific columns
Reordering Columns
- In the column visibility menu: Drag and drop columns using the handle (⋮⋮) to reorder them
Column visibility and order preferences are saved in your browser, allowing each user to customize their view independently. However, these settings will be reset if you clear your browser cache or switch to a different browser or device.
Export to CSV
Export request data to a CSV file for external analysis.
- Configure sorting and column visibility as desired
- Click the Download icon (↓) in the toolbar
- A CSV file is generated and downloaded containing visible columns in the configured sort order
The CSV export includes all requests (filters not applied) up to the maximum limit defined by the MD_MaxRecordsPerExport parameter (default: 10000 records). This limit can be adjusted by Tenant Administrators in Settings > Parameters.
View Modes: Card vs. List
Both Requestor and Management Consoles support two display modes for viewing requests.
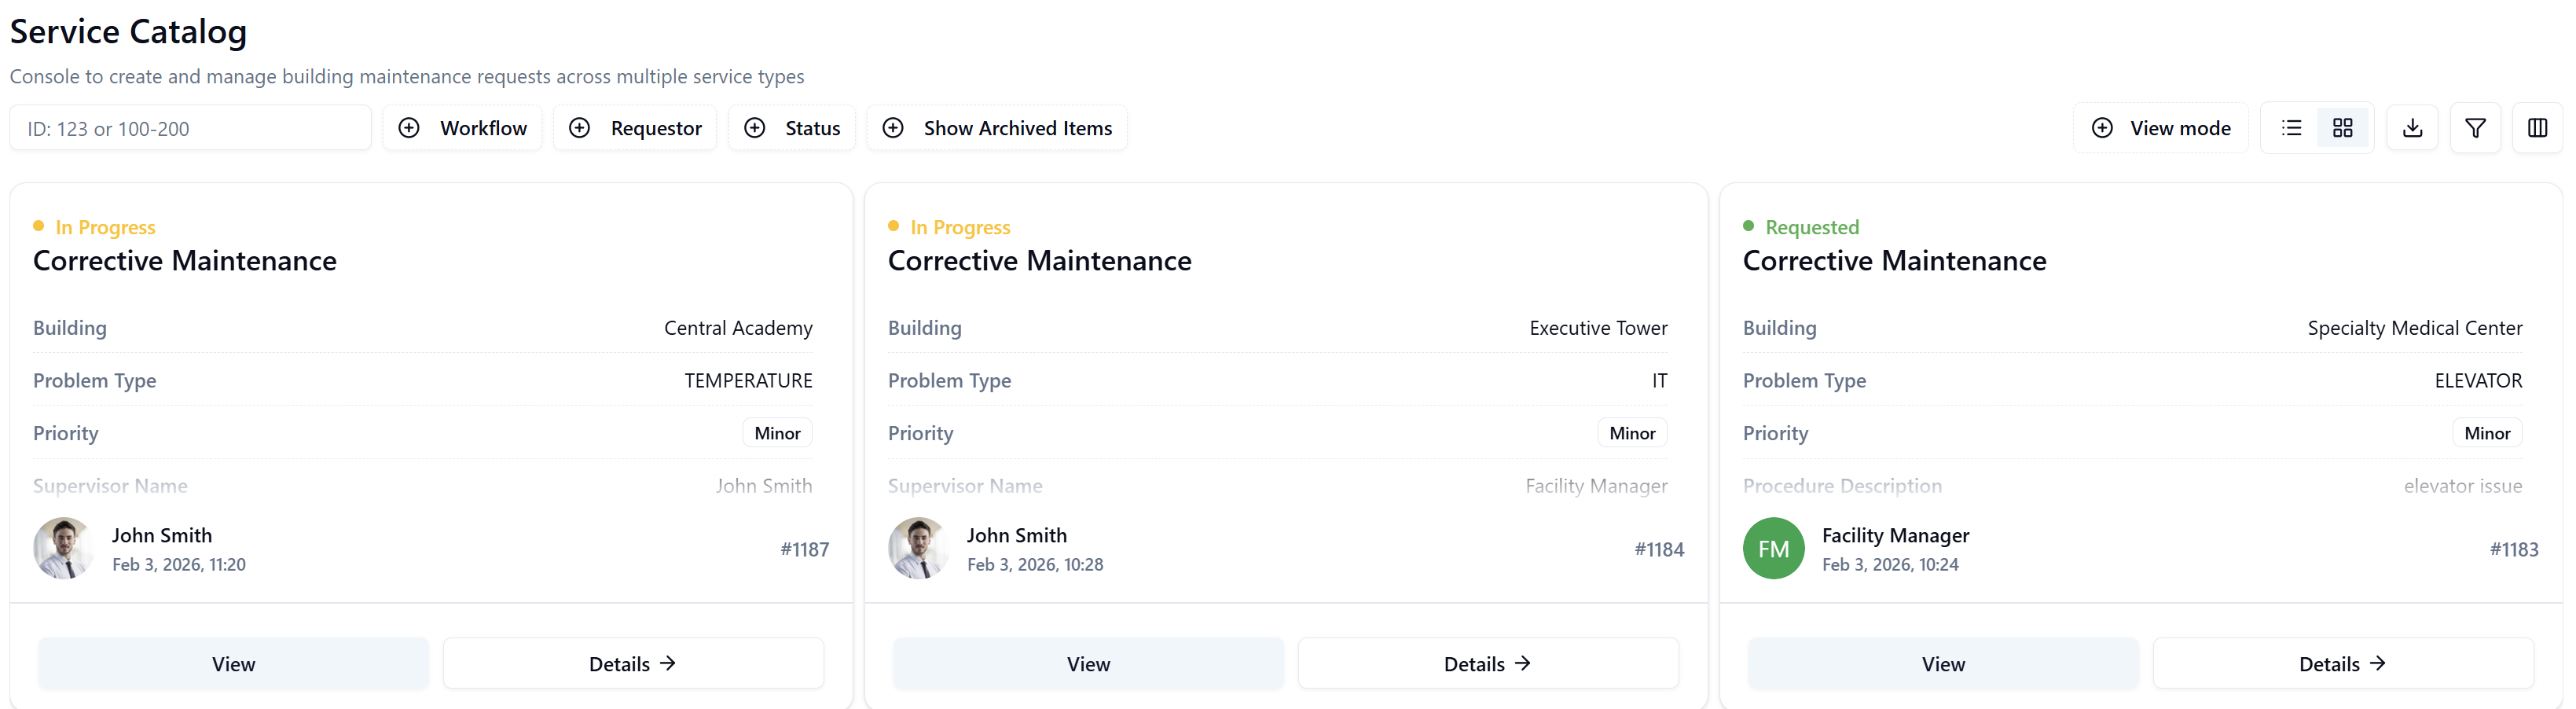
Card View
Features:
- Visual card-based layout
- Displays 3 requests per row (depending on screen size)
- Shows key fields on each card
- Ideal for browsing and quick overview
List View
Features:
- Tabular layout with rows and columns
- Shows all configured fields
- Sortable columns (click headers)
- Ideal for detailed analysis and comparison
- Supports pagination (50, 100, 200 rows per page)
Switching Between Views
Use the view toggle buttons in the top-right toolbar:
- Card View: Click the grid icon
- List View: Click the list icon
Statistics Dashboard
Management Consoles include a Statistics button that provides analytics and insights on request data.
Accessing Statistics
Click the Statistics button in the top-right corner (next to New Request) to open the statistics dashboard.
Statistics Overview
The statistics dashboard displays key performance metrics with trend indicators:
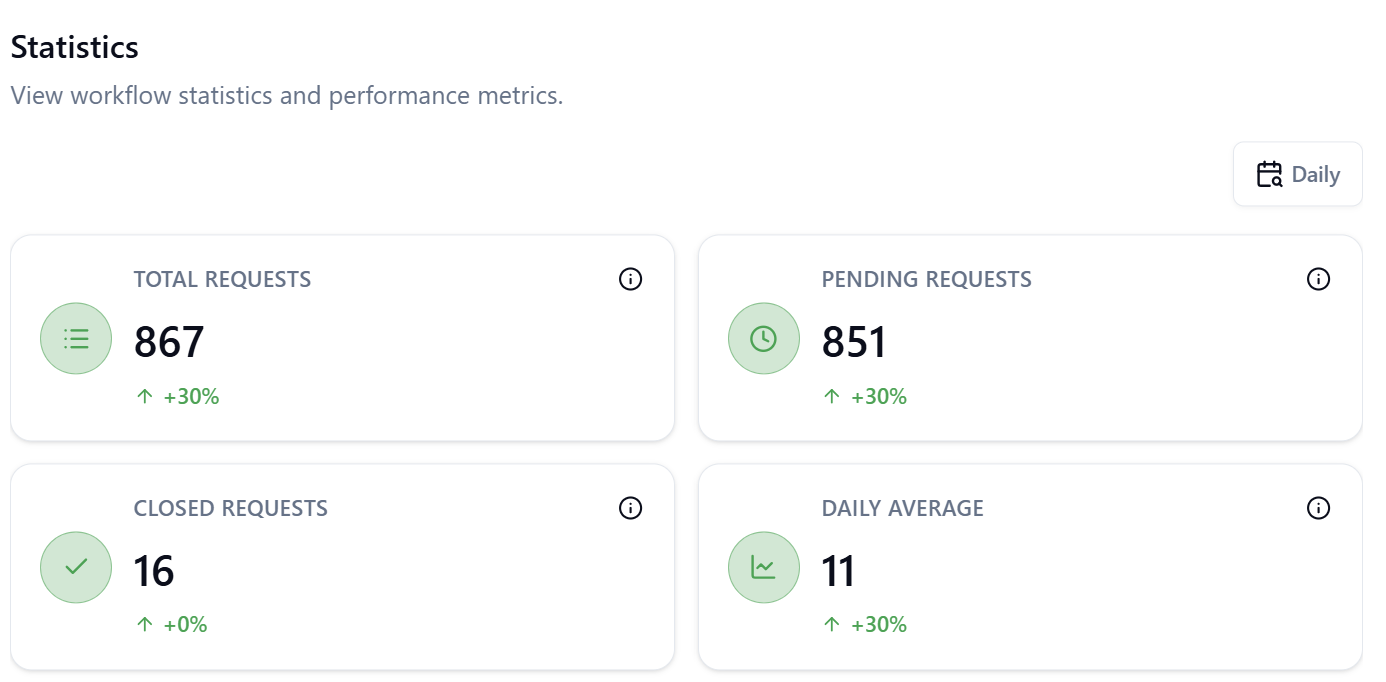
Core Metrics:
- Total Requests: Total number of requests across all workflows
- Pending Requests: Number of requests that are still pending across all workflows
- Closed Requests: Number of completed/closed requests
- Daily Average: Average number of requests per day
Trend Indicators:
Each metric displays a percentage change (e.g., +30%, -15%) showing the increase or decrease compared to the previous period. The comparison period depends on your selected time range.
Time Period Selection
Use the time period dropdown in the top-right corner to adjust the statistics view:
- Daily: Shows today's metrics compared to yesterday
- Weekly: Shows this week's metrics compared to last week
- Monthly: Shows this month's metrics compared to last month
- Quarterly: Shows this quarter's metrics compared to last quarter
- Yearly: Shows this year's metrics compared to last year
Green upward arrows (↑) indicate increases, while red downward arrows (↓) indicate decreases compared to the previous period. Monitor these trends to identify patterns in request volume and processing efficiency.
Best Practices
Console Design
- Use descriptive names: Choose console names that clearly indicate their purpose
- Limit service types/workflows: Include only related service types or workflows in a single console to avoid overwhelming users
- Order fields logically: Place the most important fields first in the Field Order configuration
- Use consistent field names: Ensure field labels are clear and consistent across workflows
Requestor Consoles
- Group related service types: Create separate consoles for different departments or service categories
- Provide clear descriptions: Write service type descriptions that help users select the correct option
- Include common fields: Ensure all essential fields are visible in the Recent Requests view
Management Consoles
- Include multiple workflow versions: If managing legacy and new processes, include both versions
- Configure sensible defaults: Set default filters to show actionable items
- Enable Statistics: Provide managers with analytics for performance monitoring
- Use View Modes: Leverage "Delegated to me" to show each manager their assigned requests
Field Configuration
- Balance information and clutter: Include enough fields to be useful, but not so many that the interface becomes overwhelming
- Prioritize actionable data: Show fields that help users make decisions (Priority, Status, Building, Problem Type)
- Hide internal fields: Exclude system-generated or technical fields from the list view
- Test with end users: Validate field ordering and visibility with actual console users
Troubleshooting
Console not appearing in navigation after publishing
Problem: After publishing a console, it doesn't appear in the sidebar navigation menu.
Solutions:
- Verify the console was successfully published (check for a confirmation message)
- Refresh your browser or clear cache, then log out and log back in
- Check user permissions – ensure your role has access to the selected process
- Verify the process selection during publishing was correct
- Contact your administrator if the console still doesn't appear after trying these steps
Service type not initializing workflow
Problem: Clicking a service type in the Service Catalog does nothing or displays an error message.
Solutions:
- Verify the service type has "Publish in Service Portal" enabled in Facility Maintenance app > Service Types
- Check that the linked workflow is published and has an active version
- Ensure the workflow has a valid start form configured
- Review GWE role permissions – confirm you have access to initiate the workflow
- Check the browser console for error messages that might indicate the specific issue
Expected fields not appearing in console
Problem: Fields that should be visible are missing from the list view or detail view.
Solutions:
- Verify the fields are checked in Common Fields or workflow-specific field configuration in the console definition
- Ensure the fields exist in the published workflow forms
- Check that the workflow version selected in the console includes those fields
- Click Save Changes after modifying field visibility to apply the changes
- Refresh the console and clear browser cache if fields still don't appear
Filters not working or not changing displayed requests
Problem: Applying filters doesn't change the displayed requests or produces unexpected results.
Solutions:
- Verify filter syntax is correct:
- Single ID:
123 - ID Range:
100-200(not "100 200" or "100 - 200")
- Single ID:
- Clear all filters and reapply one at a time to identify the problematic filter
- Check that the filtered field values actually exist in your dataset
- Ensure you're using the correct operator (Is, Is not, Contains) for your filter
- Refresh the page and reapply filters if the issue persists
CSV export contains wrong data or incorrect format
Problem: Downloaded CSV file doesn't match expected data or formatting.
Solutions:
- Remember that filters are not applied to CSV exports – the export includes all requests
- Check that only visible columns are exported – hide unwanted columns before exporting
- Verify that the export limit hasn't been reached (check
MD_MaxRecordsPerExportparameter) - Ensure sorting is configured correctly before exporting
- Try exporting a smaller dataset by adjusting column visibility if the export times out
Column reordering not saving or resetting
Problem: Column order changes are lost after refresh or don't apply correctly.
Solutions:
- After reordering columns, ensure you're using the drag handle (⋮⋮) to move them
- Column preferences are stored in browser local storage – clearing cache will reset them
- Try using a different browser to determine if it's a browser-specific issue
- Check that you have the latest browser version
- If using incognito/private mode, settings won't persist between sessions
Statistics not displaying or showing incorrect data
Problem: The Statistics dashboard is empty, won't load, or displays unexpected metrics.
Solutions:
- Verify you have permission to view statistics for the console
- Check that the selected time period (Daily, Weekly, Monthly) contains data
- Refresh the statistics dashboard using the browser refresh button
- Try selecting a different time period to see if data appears
- Contact your administrator if statistics remain unavailable
Summary
Management Consoles are a powerful feature in SignalSync that provide users with customized interfaces for creating and managing workflow requests. By understanding the differences between Requestor and Management consoles, properly configuring service types or workflows, and leveraging filtering and view options, organizations can streamline their processes and improve user productivity.
Key takeaways:
- Requestor Consoles are ideal for self-service request creation with Service Catalog
- Management Consoles are optimized for administrative oversight with direct workflow access
- Field configuration determines what information users see and in what order
- Filtering and sorting enable users to find relevant requests quickly
- Proper console design improves user adoption and efficiency